How the Sino-US trade war affects the manufacturing cycle and inflation.
- Long term: 145% tariffs suppress demand and accelerate decoupling. US costs rise by 8%-15%. Inventory pressure peaks in 2026, and the cycle goes down.
- Market: U.S. industrial stocks rise in the short term, while technology is under pressure; cryptocurrencies fluctuate with inflation and liquidity.
- Recommendation: Pay attention to PMI and Q1 financial reports, carefully plan manufacturing, and consider Southeast Asian supply chain beneficiary stocks.
1. Macro and market environment
The US trade war game
- China and the United States are in a stalemate: The current Sino-US trade war can be seen as a typical "chicken game", with neither side willing to make concessions first, resulting in the imposition of tariffs on each other and increasing economic losses. The final choice of both sides will have a far-reaching impact on the positions and stances of other countries in the world.
- The core of the global economic game: The attitudes of about 80 countries around the world will play a key role in the Sino-US game, especially in the escalation of the trade war and the reorganization of the supply chain. The position of global economies determines the dynamics and final outcome of the game between China and the United States.
- The transformation of the hawk-dove game: The game between China and the United States may shift from the current "chicken game" to the "hawk-dove game". The support of global economies will determine whether China and the United States can end the trade war through compromise or tough measures. Ultimately, the stability and development of the global economy may be profoundly affected by this game.
2. Analysis of capital flows & market structure of mainstream currencies
External Funding Flows
- ETF funds: This week's inflow was 3.014 billion, and the capital situation improved
- Stablecoins: 2.17 billion new coins were issued this week, with a medium issuance level
Market sentiment indicators
- OTC premium surges: Stablecoin premium rebounds to above water, with only a slight premium
Bitcoin (BTC)
- Technical aspect: At the high point of the four-hour line segment, beware of the end after the surge
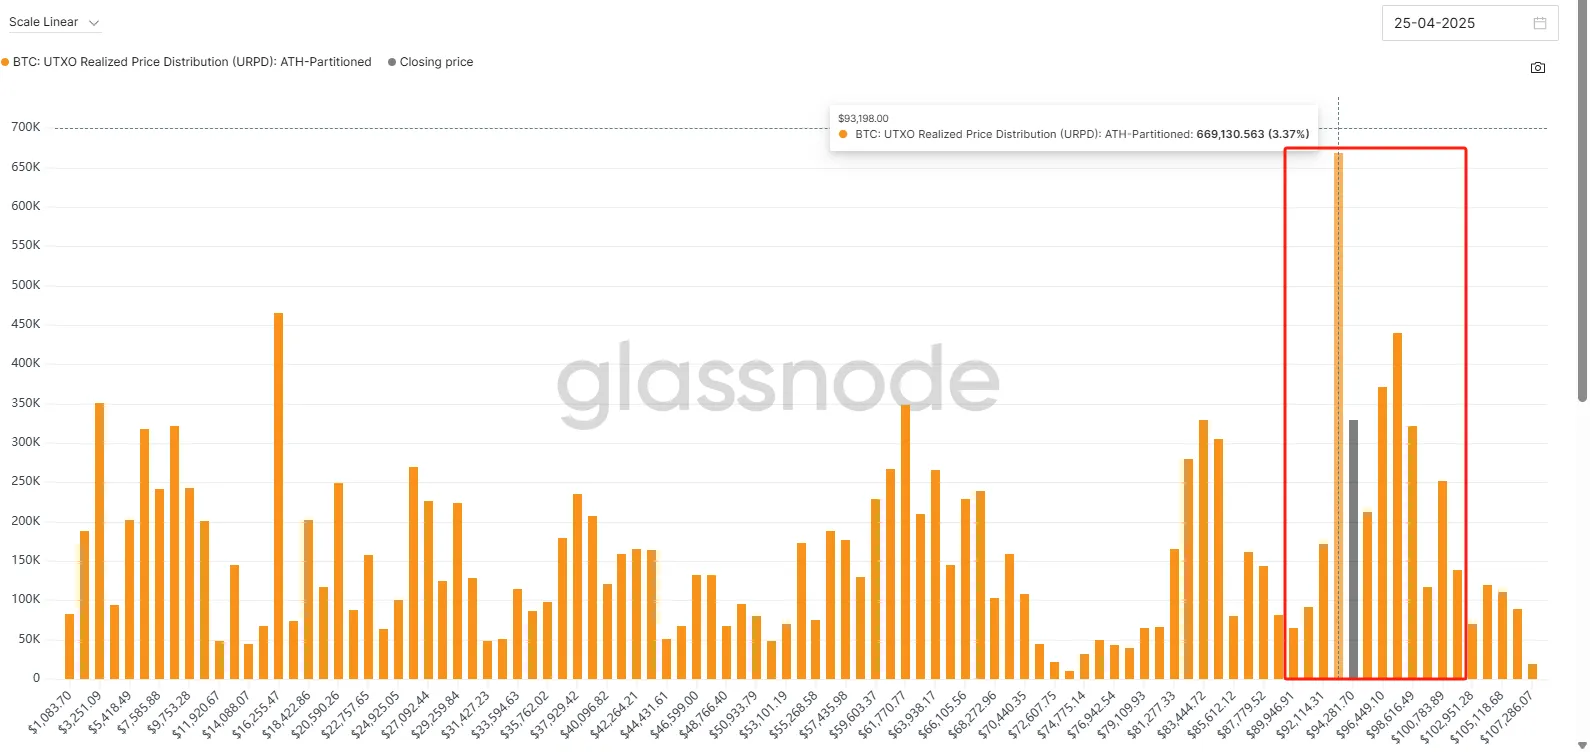
- On-chain chip distribution: The chip peak returns to around 93,000
Ethereum (ETH)
- The trend is weaker than BTC . ETH/BTC maintained volatility and then broke down this week, and funds continued to flow back to BTC dominance.
- On-chain changes: The increase in active addresses may indicate that the staged bottoming out has been completed.
Macroeconomic Review
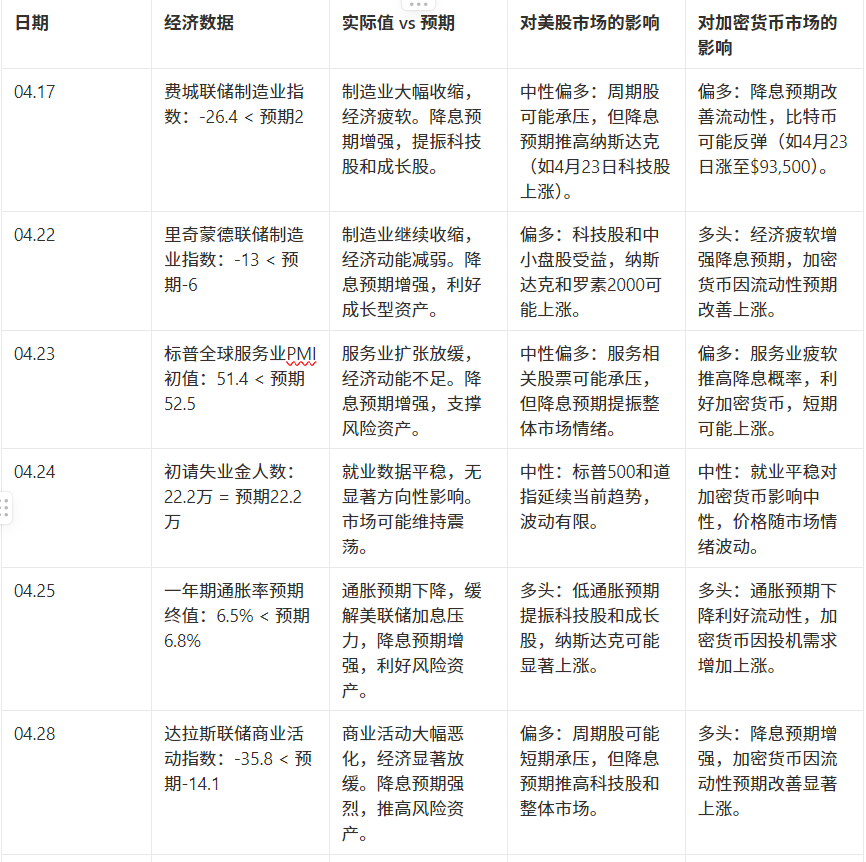
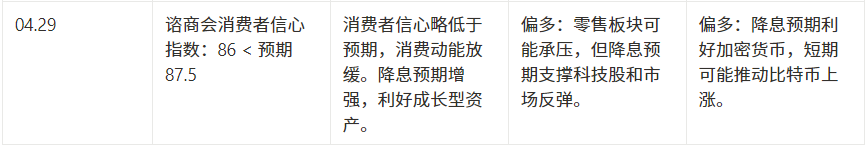
Expectations of interest rate cuts increased (lower than expected data)
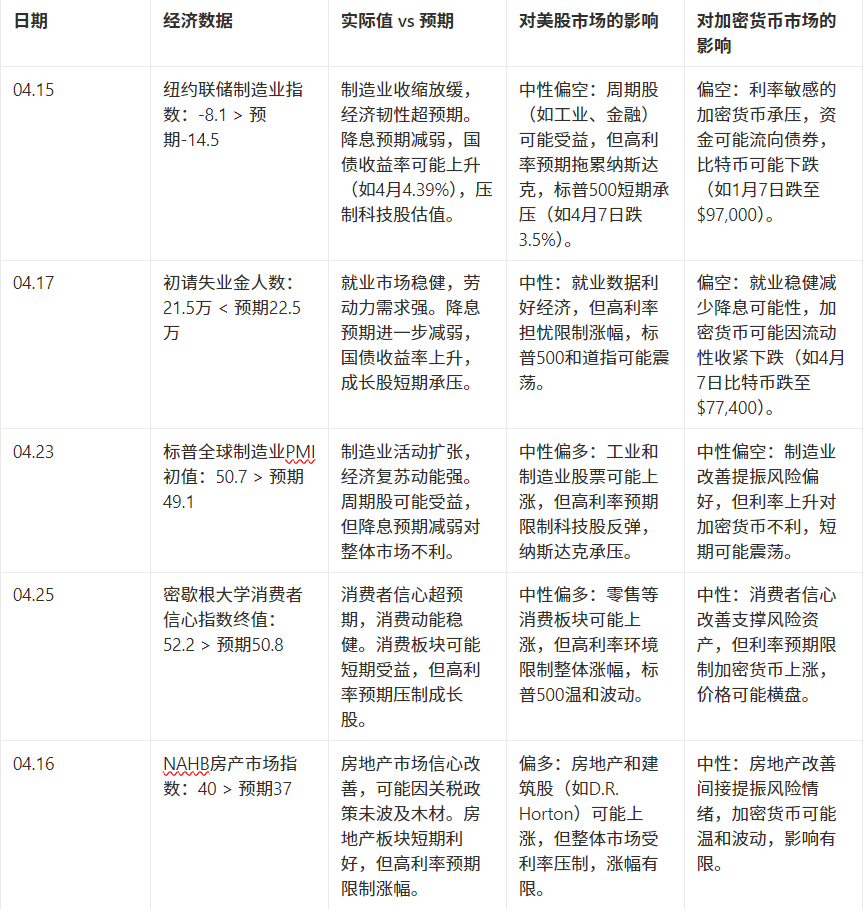
Expectations of interest rate cuts weakened (surpassed expectations)
The impact of tariffs and the manufacturing cycle
1. Enterprise feedback and tariff pressure
Survey data:
- Richmond CFO Survey (March): 30% of companies view tariffs as their primary concern (only 8.3% in Q4 2024), and the number of financial reports mentioning "tariffs" and "recession" has increased sharply.
- Philadelphia Fed (April): Price expectations hit a July 2022 high, with 19.2% of companies expecting intermediate goods to rise in price, and 32.3% expecting raw materials to rise by 3%-4%.
- Goldman Sachs survey (April 14):
Order adjustment: 41% of manufacturers expect that more than 50% of Chinese orders will be affected, and 36% expect that the impact will be less than 20%.
Price transfer: 60% of manufacturers re-priced (electronics, consumer goods), and Southeast Asian factories received expedited orders.
Transfer orders: 20% of manufacturers turned to Southeast Asia (textiles), Taiwan, Japan, South Korea and India (electronics), and Europe and India (raw materials).
Manufacturer behavior:
- Rush to export: From January to March, exports from China, Vietnam and Taiwan increased by 20%, while imports from the United States increased by 20%.
- Replenishing inventory: Customers stockpile low-cost inventory, pushing up Q2 inventory.
- Transfer orders: textile and footwear to Vietnam/India, electronic turntables to Japan/Korea/India, auto parts to Mexico/Canada.
2. The impact of tariffs on the manufacturing cycle
2.1 Short term (Q2-Q3 2025): rush to export and inventory accumulation
Hard data is strong:
- Imports and exports of China, Vietnam and the United States increased by 20%, and industrial production in China and Vietnam increased.
- Consumer electronics: PC/mobile phone shipments in Q2 are revised upward, but the growth rate in 2025 will drop to 0%-3%.
- Textile and footwear: Shoe prices increased by 11.6% (49% tariff), and sales volume fell by 10%-15%.
- Automobiles: Q2 sales hit a record high since March, but demand fell in the second half of the year due to advance purchases.
Inventory pressure:
- Manufacturers are hoarding goods to avoid tariffs. If the 145% tariff takes effect, there is a high risk of inventory backlog in Q3.
market:
- US stocks: The industrial sector rose 3%-5%, and inflation (4%-5%) suppressed technology stocks.
- Cryptocurrency: Risk appetite pushes prices higher (Bitcoin to $93,500), inflation risk may lead to a pullback.
2.2 Medium to long term (Q4-2026): Demand overdraft and downturn
Demand falls:
- Consumer electronics: Prices increase by 10%-20%, and shipments remain flat in 2025.
- Textile and footwear: A 145% tariff caused China’s exports to drop by 80%, shoe prices to rise by 50%, and sales to drop by 15%.
- Automobile: Electric vehicle prices increased by 10%-15%, sales declined, and the supply chain was fragmented.
Supply chain decoupling:
- Team China: BYD and Huawei turn to the global south, accounting for 30% of global manufacturing.
- The American team: Tesla and Apple rely on the United States, Mexico and Canada, and their costs have increased by 8%-15%.
- Transfer orders: textiles to Vietnam/India, electronics to Taiwan/Japan/Korea/India, automobiles to Mexico.
Downward cycle:
- Inventory clearance pressure will peak in 2026, and the manufacturing cycle will worsen.
market:
- US stocks: Technology/Nasdaq fell 5%-10% due to slowing inflation and rate cuts (2 vs. 4 times).
- Cryptocurrency: Liquidity tightening leads to a pullback (Bitcoin to $77,400), long-term easing or rebound.
2.3 Comparison of the 2018 Trade War
- Similarities: soft data (PMI) peaked in Q2, while hard data (exports) fell after Q3.
- Differences: Higher tariffs in 2025 (145% vs. 25%), deeper decoupling, and stronger inflation (4%-5% vs. 2%-3%).
3. Key observation points
- Soft data: PMI and price expectations peaked in Q2-Q3, indicating a slowdown.
- Hard data: Exports/industrial production increased by 20% in Q2 and slowed down after Q3.
- Financial report: Apple, Nike, and Tesla provide guidance on tariff costs and demand in Q1.
- Policy: The Federal Reserve will slow down interest rate cuts if inflation reaches 4%-5%, and tariff exemptions (such as mobile phones) will affect inventory.
4. Conclusion
- Short-term: The rush to export in Q2 pushed up the data (up 20%), but the risk of inventory backlog increased. Prices of electronics, textiles, and automobiles rose by 10%-50%, and sales fell.
- Long term: 145% tariffs suppress demand, accelerate decoupling, and US costs rise by 8%-15%. Inventory pressure peaks in 2026, and the cycle is down.
- Market: U.S. industrial stocks rise in the short term, while technology is under pressure; cryptocurrencies fluctuate with inflation and liquidity.
- Recommendation: Pay attention to PMI and Q1 financial reports, carefully plan manufacturing, and consider Southeast Asian supply chain beneficiary stocks.
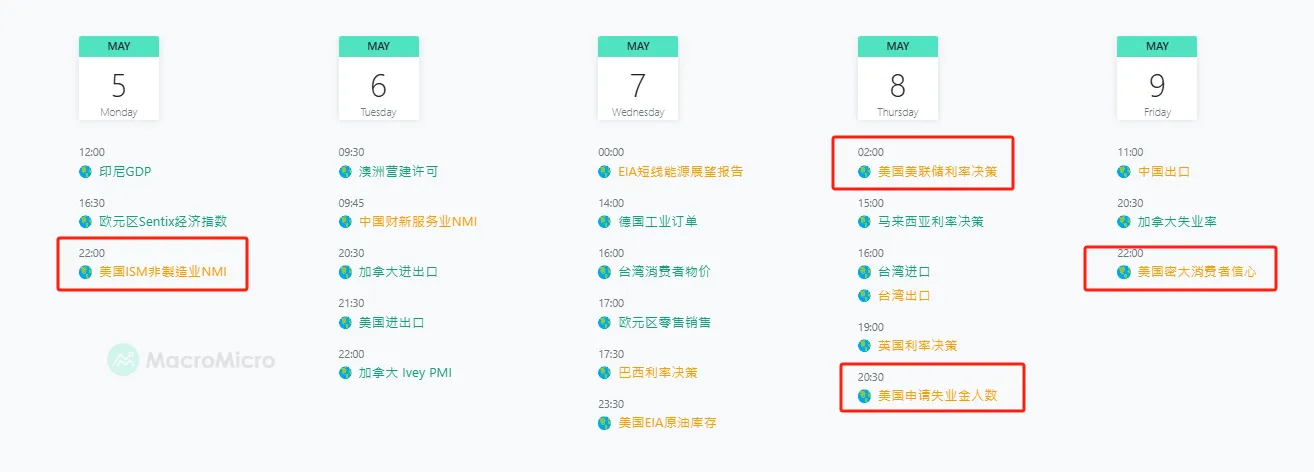
Next week's data outlook
2. On-chain data analysis
1. Changes in short- and medium-term market data that affect the market this week
1.1 Stablecoin Fund Flow
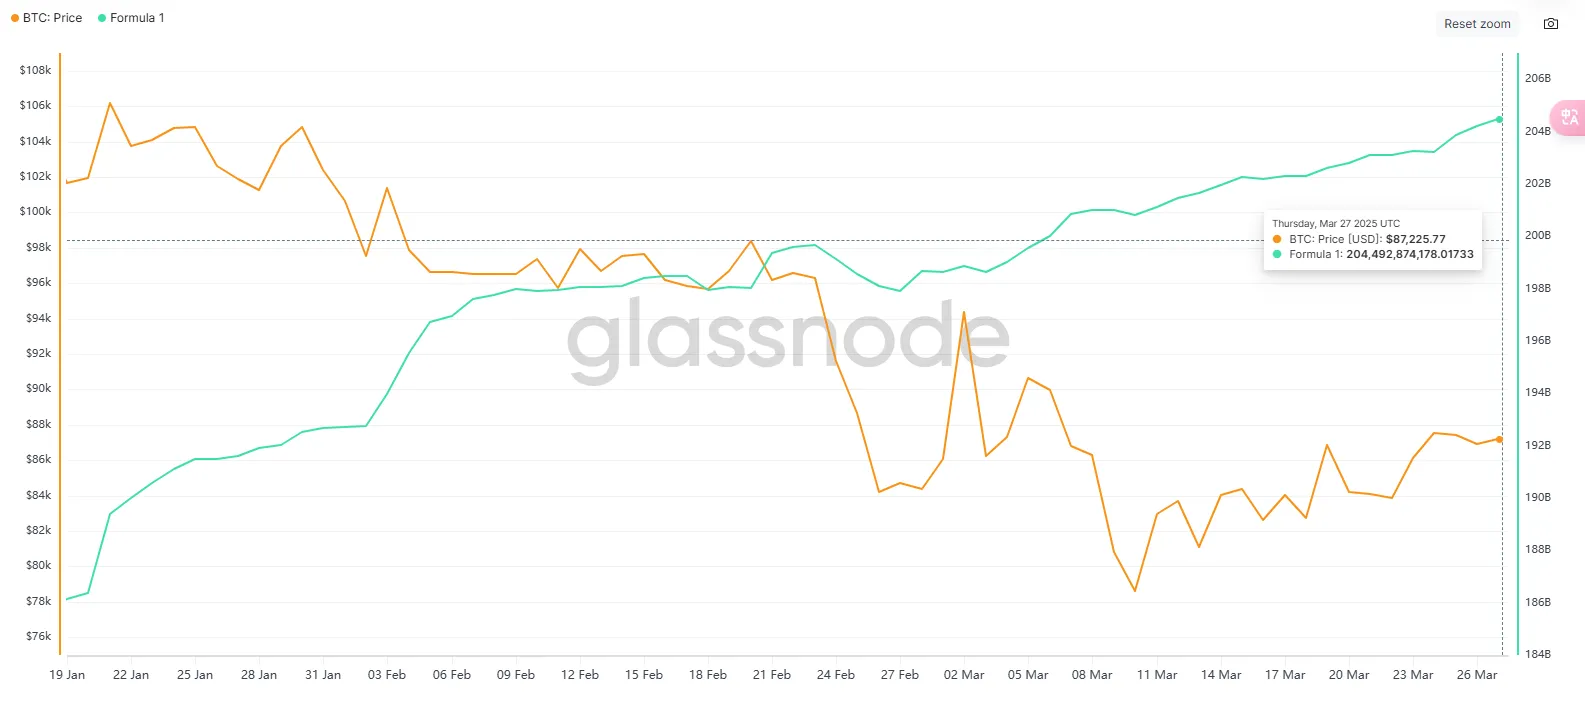
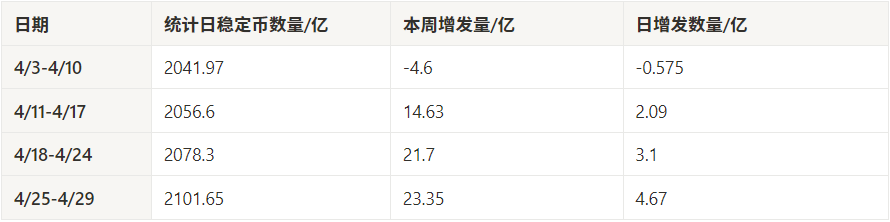
The total amount of stablecoins in the past five days this week reached 210.165 billion, the highest since April, up 2.335 billion from last week, and the average daily issuance was as high as 467 million, reaching the average daily issuance of the second wave of the main upward trend last year. The accelerated inflow of funds reflects the significant warming of market sentiment.
Stablecoin expansion is accelerating, and speculative funds may enter an active phase
Judging from the weekly growth rate, it has been rising steadily for three consecutive weeks in April. This week's growth rate is not only the highest in a single week, but also shows an accelerating growth trend. It may reflect the acceleration of long positions or the entry of some institutions, resulting in a significant expansion of on-chain funds.
In the short term, beware of the volatility amplification effect after rapid accumulation of funds
Although capital inflows are a positive sign of market activity, the rapid issuance of stablecoins may also indicate a short-term accumulation of leverage. It is necessary to pay attention to whether there is high-frequency rotation or hedging of funds on the chain, and be careful to prevent rapid outflows in extreme market conditions from causing market fluctuations.
1.2 ETF Fund Flow
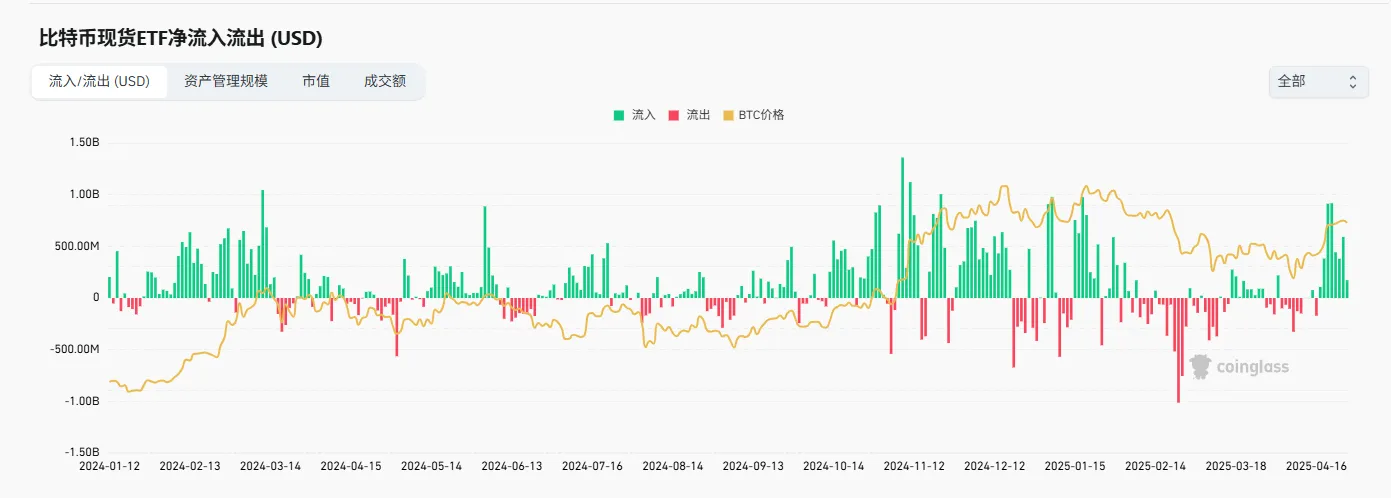
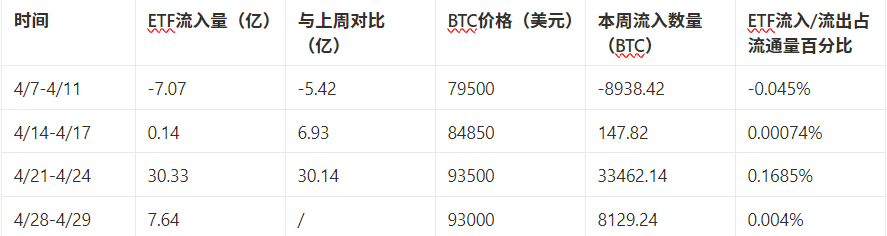
Although the inflow this week decreased compared with the previous week, the intensity is still medium to high , with an equivalent inflow of US$1.91 billion. Although it is less than the 3 billion in 4/21-24, it is much higher than the levels of 4/14-17 and 4/7-11, indicating that capital sentiment is still active and the market still has continued allocation demand, but the pace has slowed down.
ETF's "control power" is slightly stronger than neutral, and still belongs to incremental support
After adjustment, the holdings increased by about 20,000 BTC. Although it did not dominate the BTC market, it formed a perceptible buying pressure;
This resonates with the continued issuance of stablecoins this week, supporting the market's bullish expectations.
Pay attention to the rhythm shift: from "explosive inflow" to "gentle absorption"
There was an explosive inflow of funds last week, and there were obvious signs of institutional buying;
This week, it is more like absorption at a high platform, and the overall rhythm has become stable. In the future, we may have to wait for catalytic factors such as guidance from the Federal Reserve and policy expectations.
1.3 OTC Discounts and Premiums
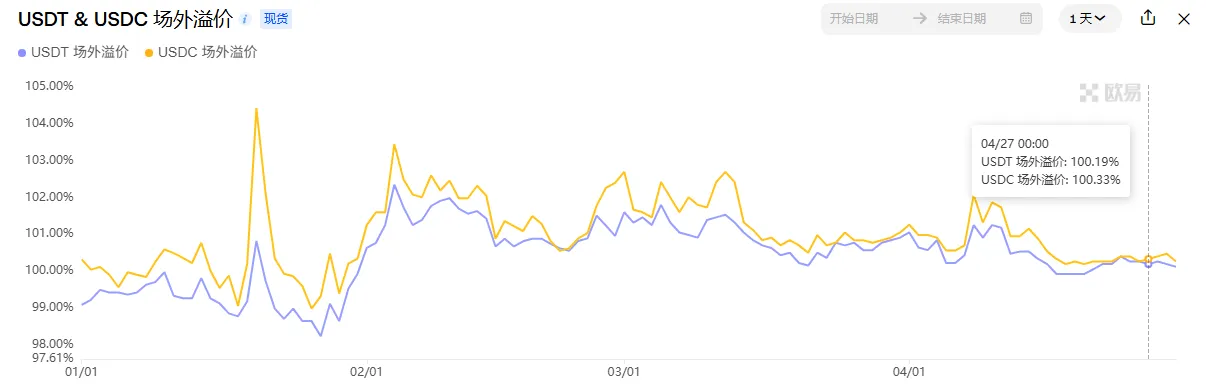
This week, the OTC premium/discount is in a small fluctuation stage, which is highly synchronized with BTC at 9.3w-9.5w. There is no special abnormal situation.
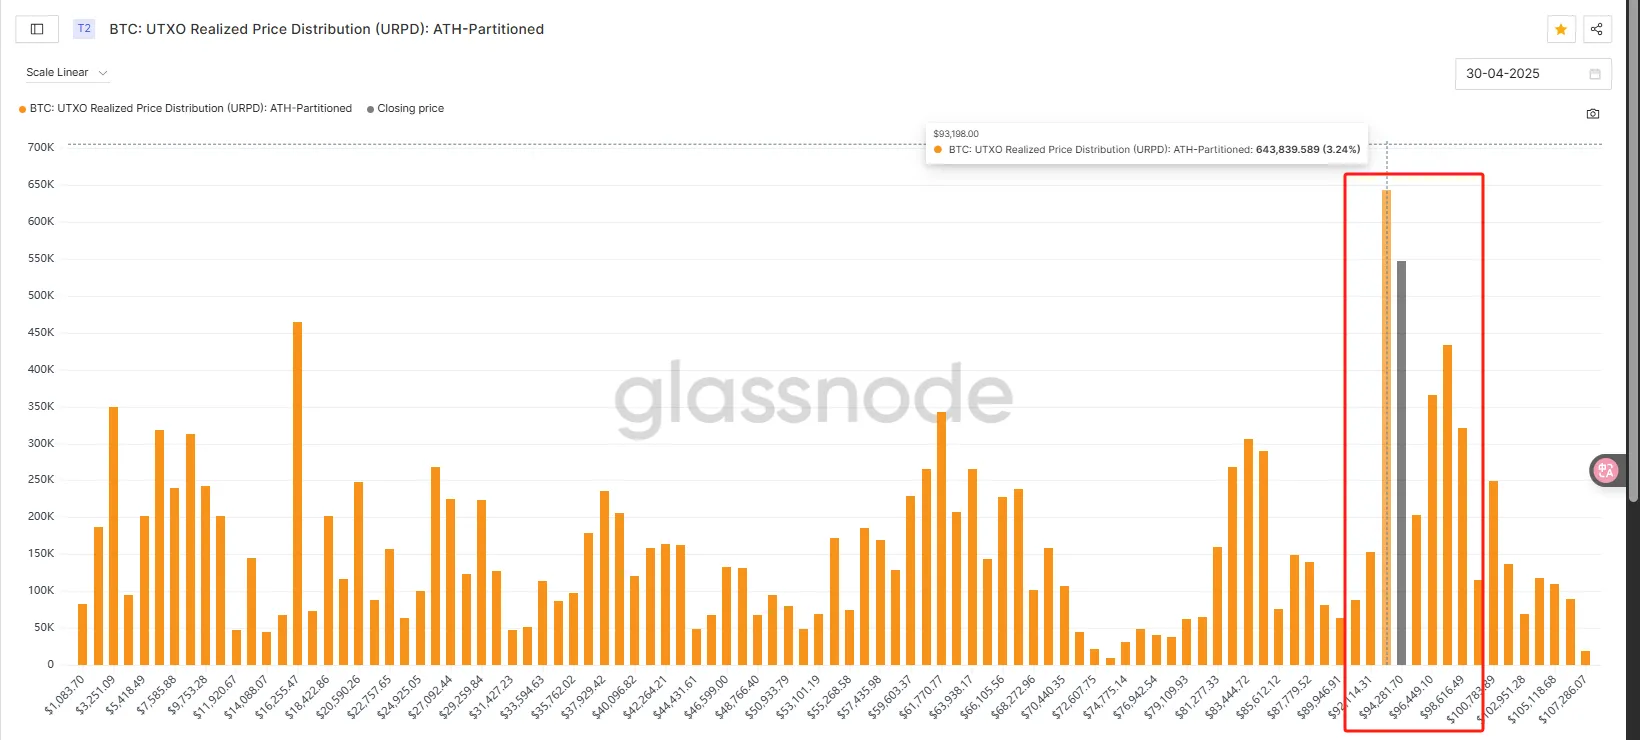
1.4URPD
The left picture is the chip distribution chart on the 25th. As the price continues to rise, the chip peak has reached 9.3w, returning to the previous chip range. The right picture shows the chip volume on the 30th. The overall chip volume has returned to the previous range of 9.75w. Judging from the time of the accumulated chips on the chain, the upper resistance level is still not 9.75w.
2. Changes in mid-term market data that affect the market this week
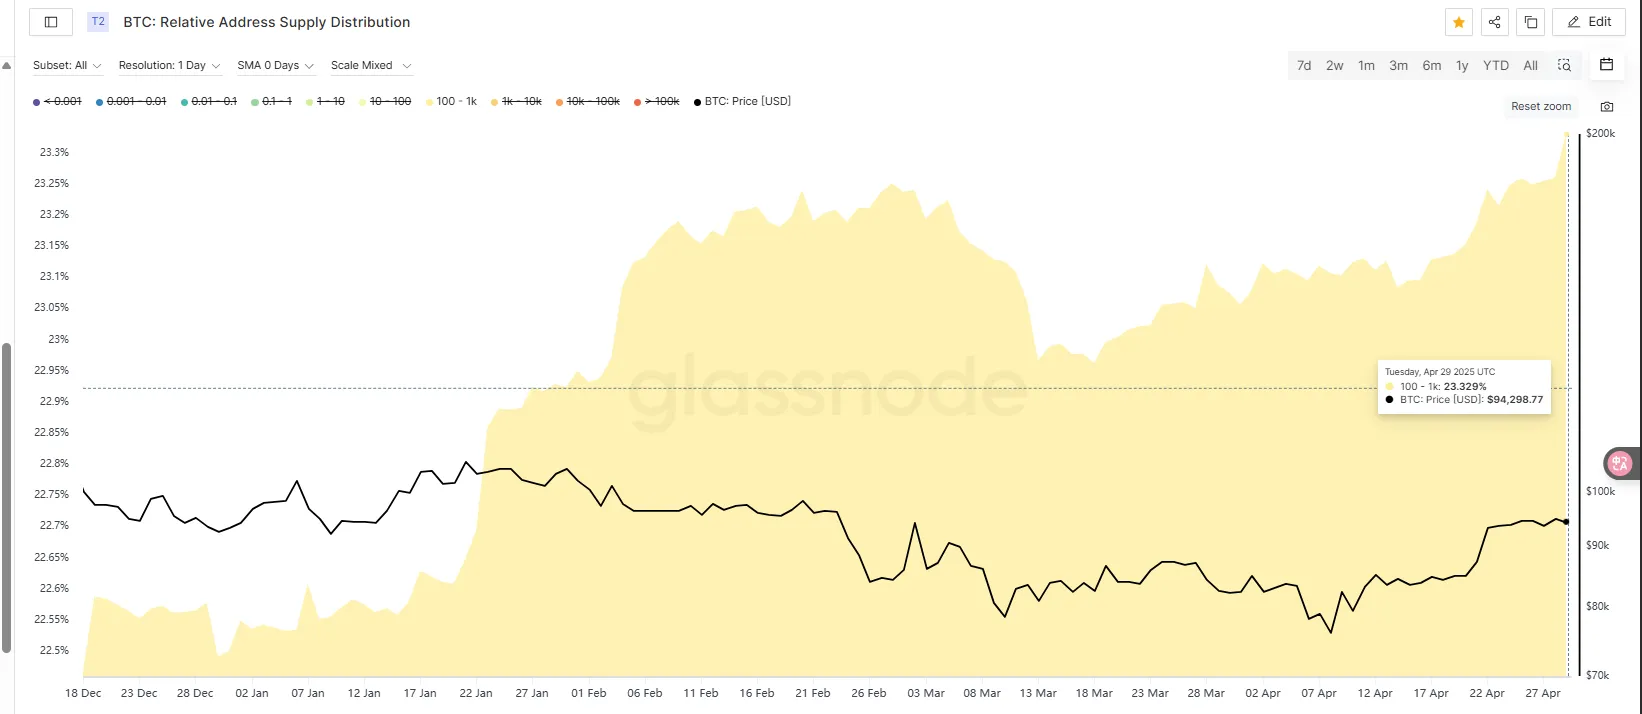
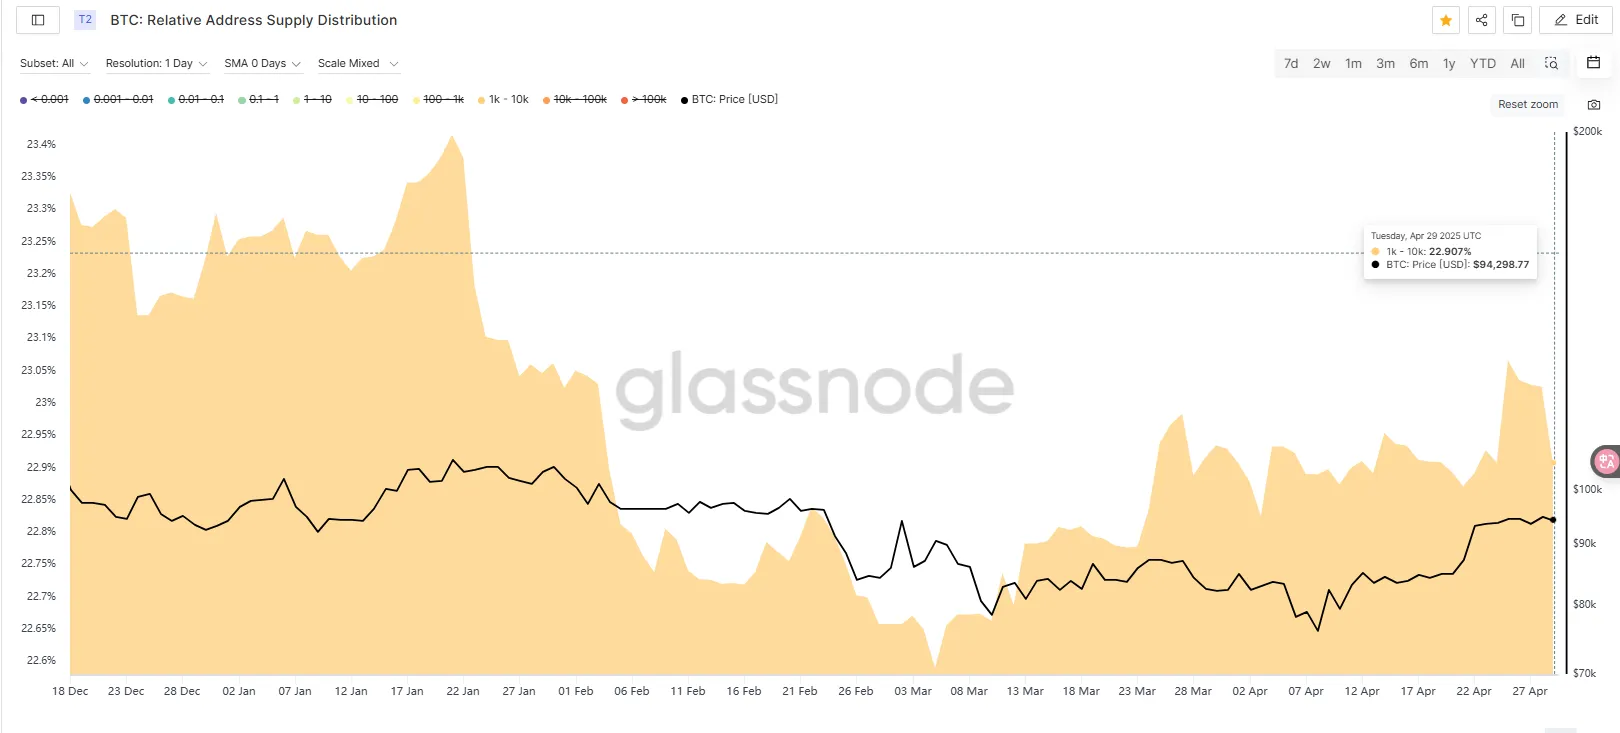
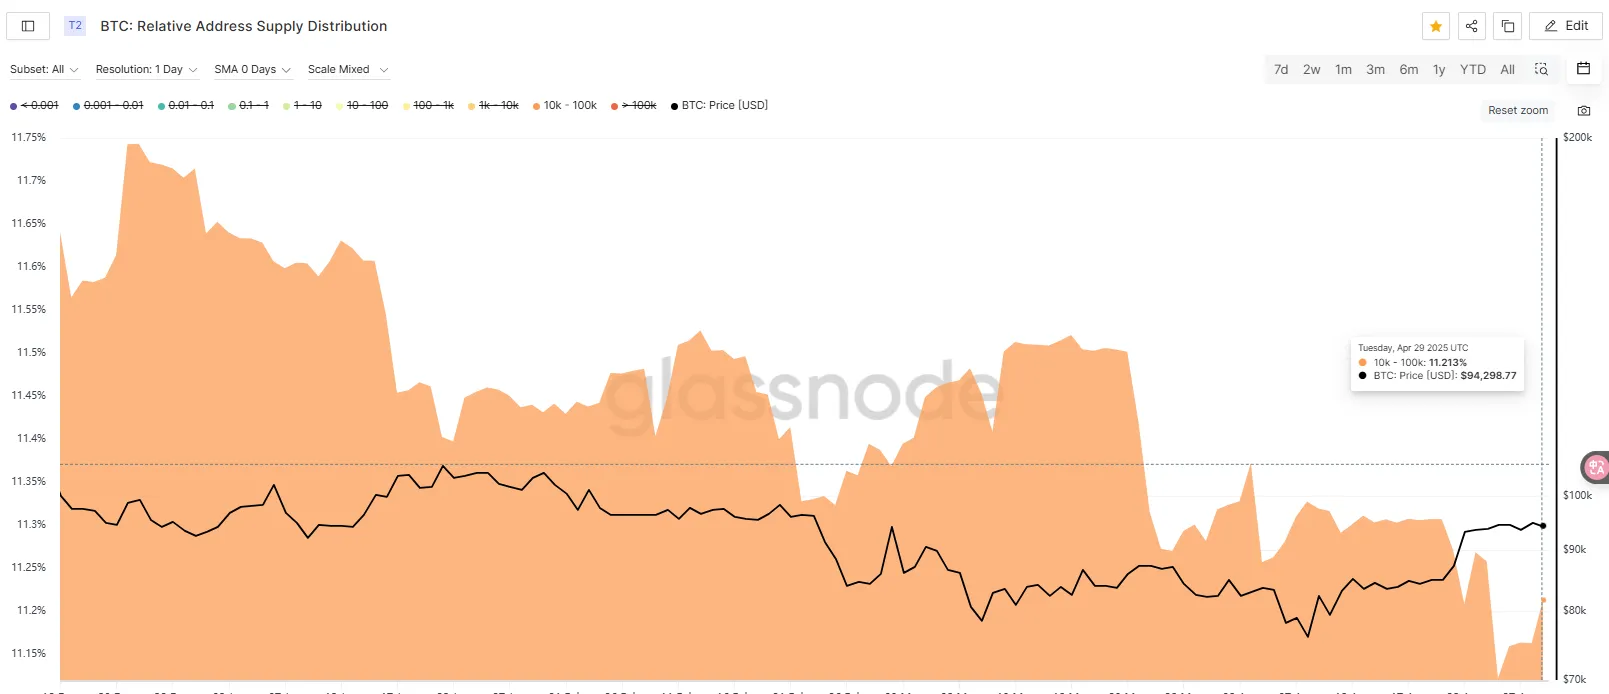
2.1 Proportion of coins held by coin holding addresses
This week's on-chain data shows that the number of addresses with 10k-100k increased by 15,000, the number of addresses with 1k-10k decreased by 11,000, and the number of addresses with 100-1k increased by 17,000. The overall change is not big, but the trend is that the chips of whales with more than 10k are spreading more and more to other small and medium-sized retail investors. Such a structure will increase the number of market participants and make the structure more stable.
2.2 Analysis of disk shape
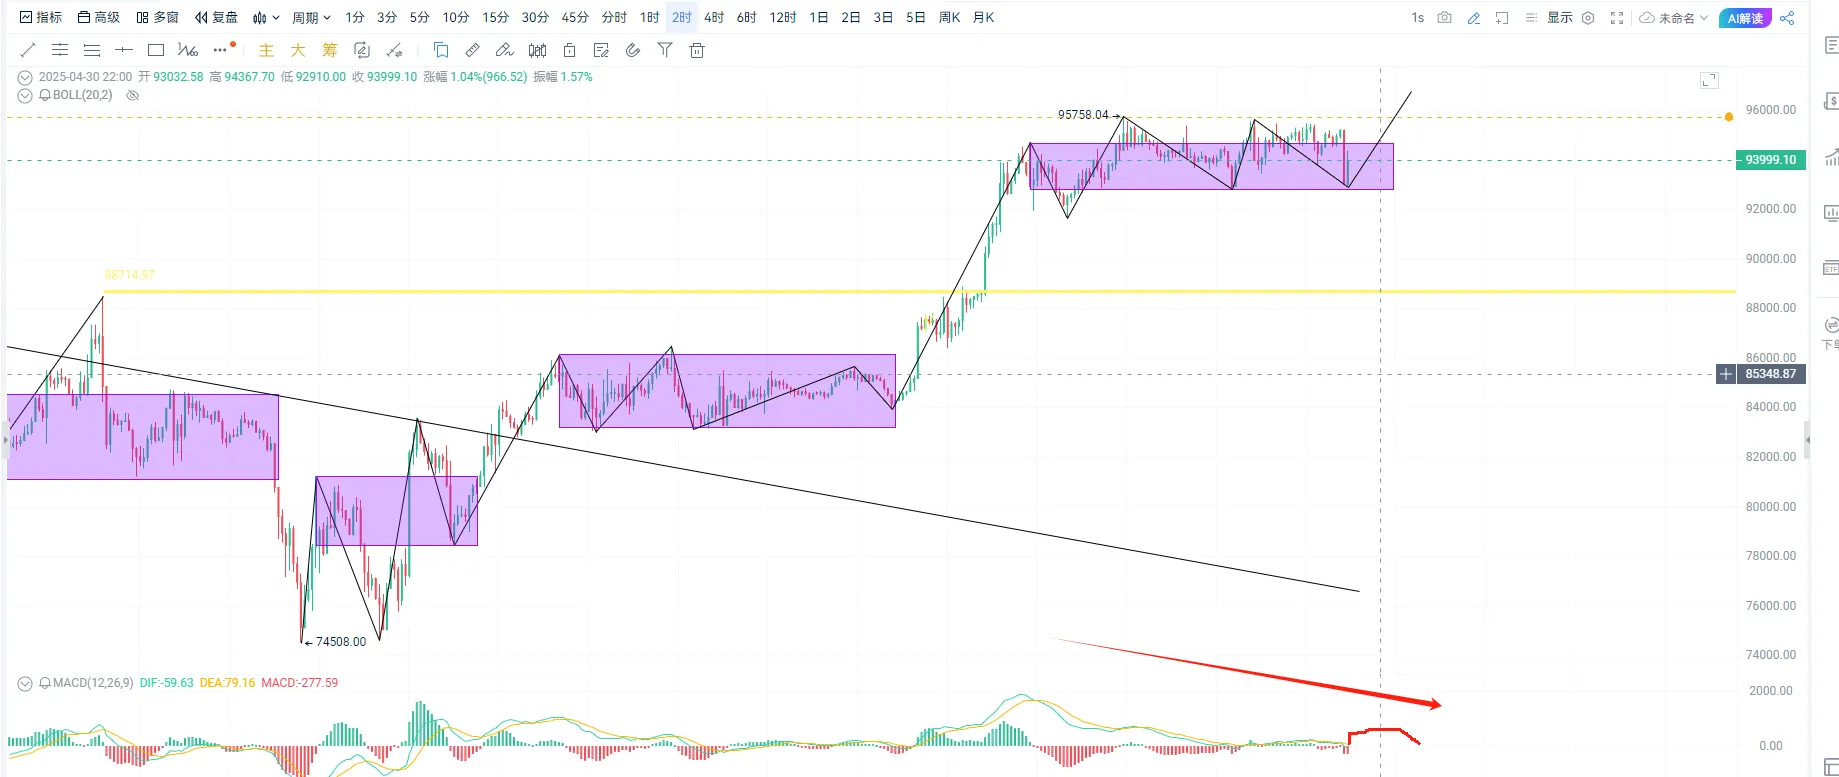
Judging from the disk pattern, BTC lacks an upward breakthrough of 957 to form a trend divergence, but it has not broken through the previous high of 957, and it is difficult to make a judgment on the oscillation position in the middle. The real negative line K at 21 points on 4/30 closed at the lower track of the upper trading range, which means a turn from strong to weak. The aggressive ones can arrange a small short order above the rebound and place the stop loss at the previous high. The conservative ones can patiently wait for the divergence of breaking through 957/falling below the lower track of the trading range and failing to pull in the short order. The target is the downward section of the 4-hour chart, which can be seen around 8.9.
Special thanks
Creation is not easy. If you need to reprint or quote, please contact the author in advance for authorization or indicate the source. Thank you again for your support.
Written by: Sylvia / Jim / Mat / Cage / WolfDAO
Edited by: Punko / Nora
Thanks to the above partners for their outstanding contributions to this weekly report. This weekly report is published by WolfDAO for learning, communication, research or appreciation only.