fomc meeting and future macro outlook
- Macroeconomic situation: The Federal Reserve maintained interest rates unchanged at the May FOMC meeting, emphasized the challenges of tariff policy uncertainty to the dual mandate, and adopted a "wait-and-see" strategy
- Capital flows: Large net inflows into ETFs + strong issuance of stablecoins, on-site funds have rebounded, supporting the market in the short term.
- Market structure: BTC fluctuates at a high level, ETH rebounds weakly, and altcoins recover quickly but there is a risk of a pullback.
- Trading strategy: Maintain a high-level defensive mentality, pay attention to the BTC 9.16w defensive position, control positions, and select strong sectors (such as SOL).
1. Macro and market environment
The balance sheet reduction continues to slow down, and liquidity needs to pay attention to changes in debt ceilings and reserves.
Powell reiterated that economic resilience supports waiting, and the timing of rate cuts depends on tariff progress and data, which will be reassessed at the June meeting.
It is recommended to pay attention to the economic data after the tariff suspension expires in July. A 2-3 basis point interest rate cut is still possible within the year.
2. Analysis of capital flows & market structure of mainstream currencies
External Funding Flows
- ETF funds: 919 million inflows this week, with a slight decrease in inflows
- Stablecoin: 2.549 billion new coins were issued in this cycle, with an average daily increase of 196 million, and the issuance level is medium
Market sentiment indicators
- OTC premium: Stablecoin premium continues to decline, with a clear divergence from price
Bitcoin (BTC)
- Technical analysis: The market is in a volatile upward range
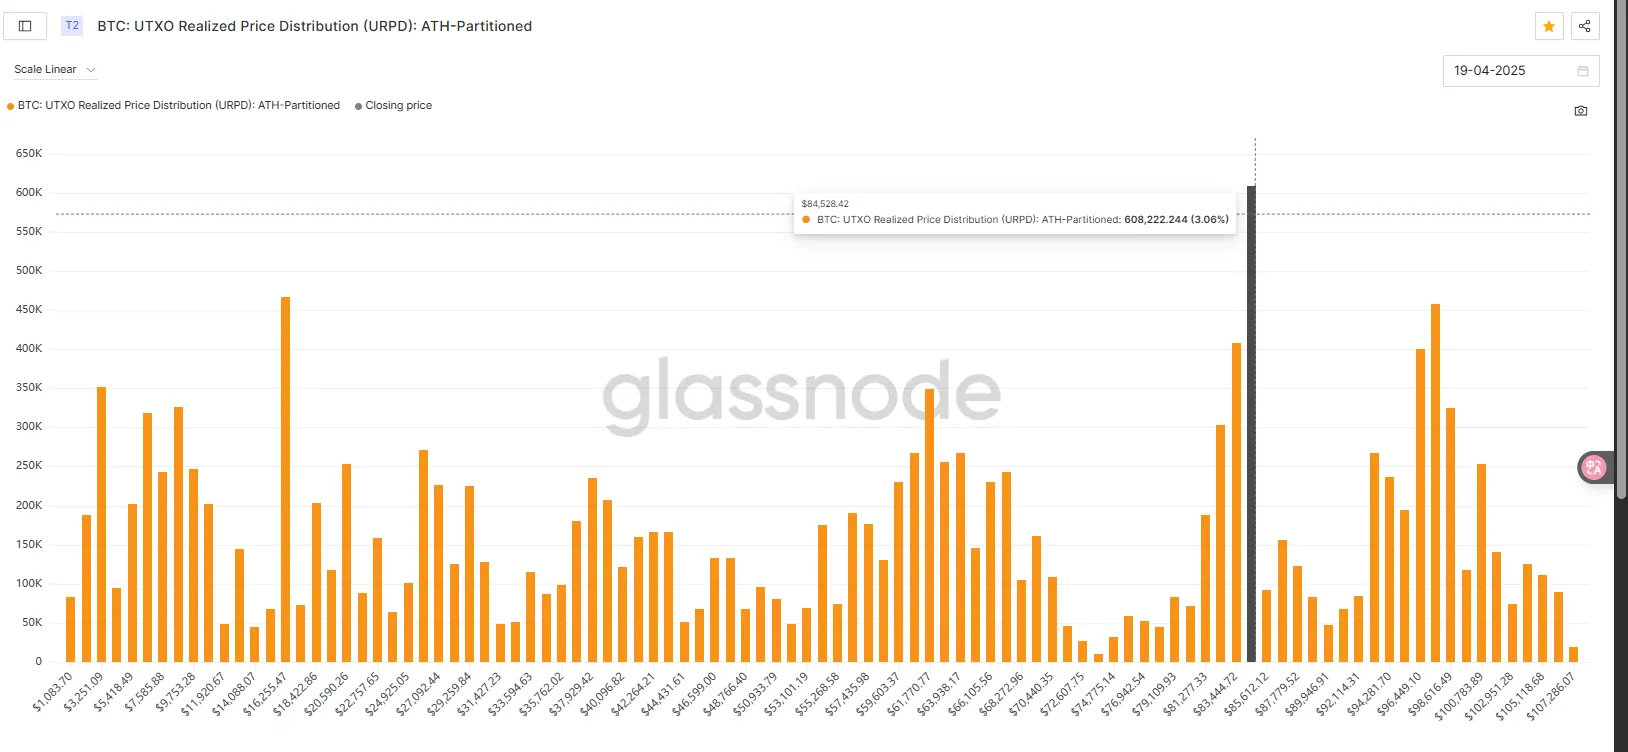
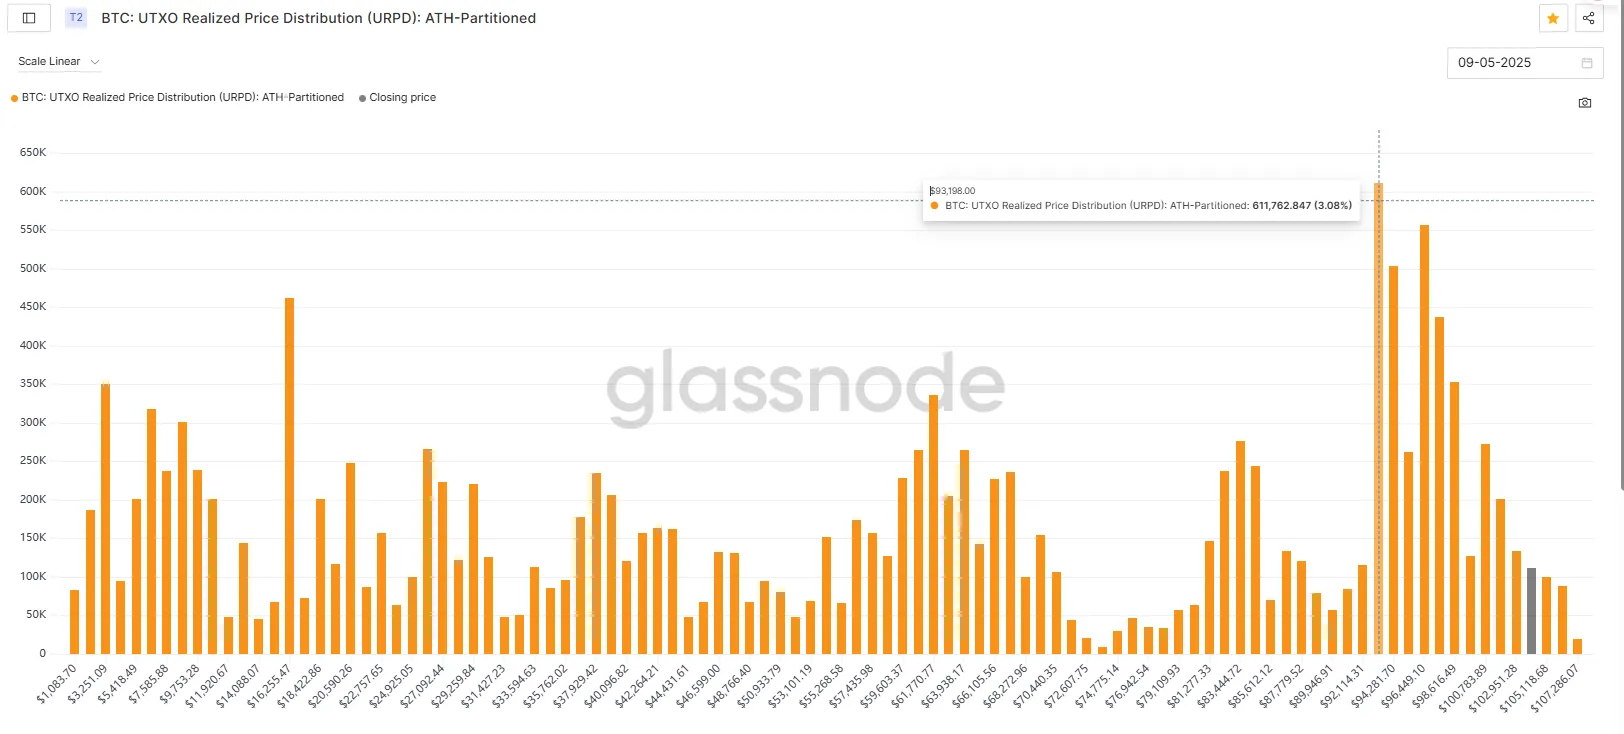
- On-chain chip distribution: The chip peak returns to around 9.3w
Ethereum (ETH)
- The trend is weaker than BTC . ETH/BTC maintained volatility and then broke down this week, and funds continued to flow back to BTC dominance.
- On-chain changes: The increase in active addresses may indicate that the staged bottoming out has been completed.
Macroeconomic Review
Summary and analysis of the May FOMC meeting
1. Key points of the meeting
1. Interest rates remain unchanged: The Federal Reserve voted unanimously to maintain the federal funds rate in the range of 4.25% to 4.50%, in line with market expectations.
2. Dual mission challenge: The statement emphasized that the risks of uncertainty in the economic outlook are rising, the risks of unemployment and inflation are increasing, and the uncertainty of the Trump administration’s tariff policy is a key variable.
3. Economic and inflation outlook:
- The economy is expanding steadily, the job market is stable, and the unemployment rate is low.
- Fluctuations in net exports affect the data, but the overall economy is resilient.
- The upward risks to inflation and unemployment are exacerbated by uncertainty in tariff policies, posing challenges in achieving the 2% inflation target and maximizing employment within the year.
4. Forward guidance on interest rates: The cautious attitude will continue. Interest rates may be lowered in the future, but the magnitude and timing will be more cautious and the pace of rate cuts is expected to be slow.
5. Monetary policy and balance sheet reduction:
- The benchmark interest rate and balance sheet reduction plan remain unchanged (the monthly investment limit for US Treasury bonds maturing is no longer 5 billion, and the investment limit for MBS is 35 billion).
- Emphasized the continued reduction of the balance sheet and firmly committed to returning inflation to 2%.
2. Balance Sheet Reduction and Liquidity Observation
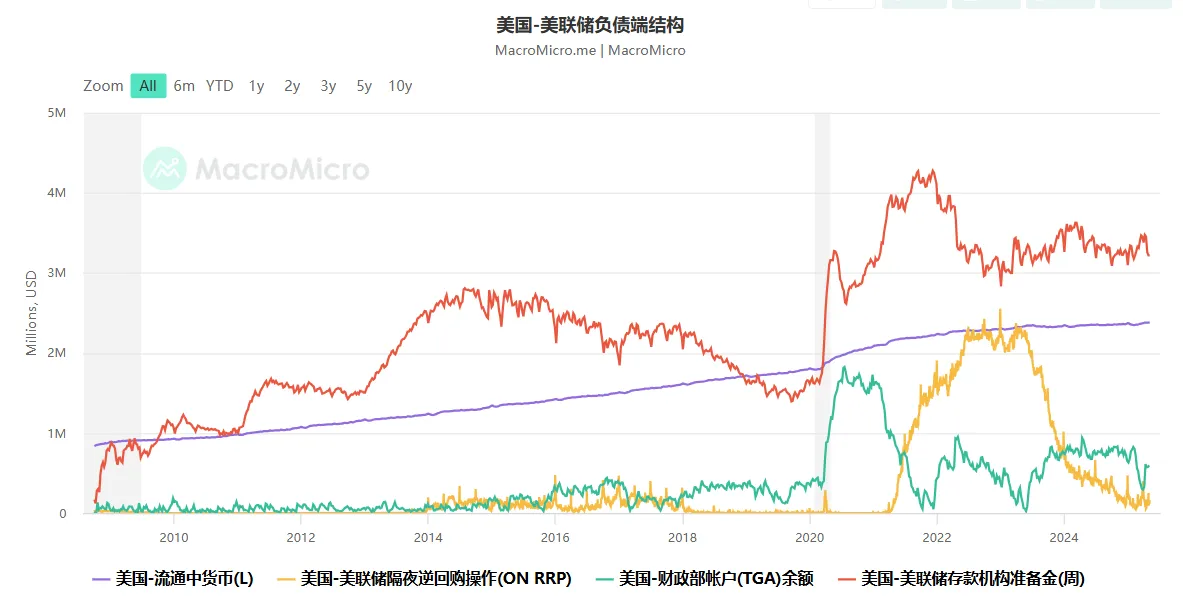
1. Progress of balance sheet reduction:
- The pace of balance sheet reduction will slow down from June 2024, and the monthly investment limit for U.S. Treasury bonds that mature will be reduced from 60 billion to 25 billion, and further reduced to 5 billion in April 2025, while MBS will remain at 35 billion.
- The current rate of balance sheet reduction is about 40 billion per month, and the balance sheet size has dropped to 6.71 trillion (a decrease of 30.9 billion in April alone).
- U.S. Treasury holdings fell from 5.77 trillion to 4.22 trillion, and MBS fell from 2.74 trillion to 2.17 trillion.
2. Liquidity and Treasury dynamics:
- After the debt ceiling expires in January 2025, the Treasury Department will initiate extraordinary measures, relying on short-term Treasury bill financing to absorb market liquidity.
- The current ON RRP balance is 129.9 billion, bank reserves are 3.219 trillion, and TGA (Treasury Cash Account) is 590.4 billion, which is lower than the target of 850 billion.
- Outlook: Before the debt ceiling is passed, short-end Treasury financing will continue, TGA will be used for general expenditures, and the support for liquidity from the decline in ON RRP and TGA will weaken.
- It is recommended to pay attention to the decline in bank reserves in July and August and be alert to the liquidity risks as the Ministry of Finance's "X-Day" approaches.
3. Key Points of Powell's Press Conference
1. "Wait and see" stance:
- The new government's policies (trade, immigration, finance, regulation) are highly variable, and the impact of tariff policies is highly uncertain, which may lead to one-time or persistent inflation.
- The Federal Reserve needs to keep long-term inflation expectations stable to prevent price increases from turning into sustained inflation.
- The current economic resilience allows the Fed to wait for the situation to become clear and assess the distance and time to achieve its dual mandate goals.
2. Balance of dual missions:
- It did not specify the priority between employment or inflation, but stressed that risks of both were increasing, but it did not face a dilemma.
- Policy will not be judged based on a single unemployment rate figure, but rather a comprehensive look at employment market data will be used.
- If both unemployment and inflation rise significantly at the same time, we will assess the degree of deviation from the target and the time of return, and make difficult decisions.
3. Monetary policy attitude:
- Inflation was just above 2%, housing and non-housing services data were positive, but the outcome of tariff negotiations was unknown.
- Given the economic resilience, the cost of waiting is low, and the Federal Reserve can act quickly once the situation becomes clear.
4. Possibility of interest rate cut:
- Current inflation is above target and has upside risks, and economic forecasts have weakened, making it unsuitable for a preventive rate cut (compared with inflation of 1.6% in 2019).
- The interest rate cut will depend on the scale and sustainability of tariffs and economic data, and the path cannot be determined in the short term.
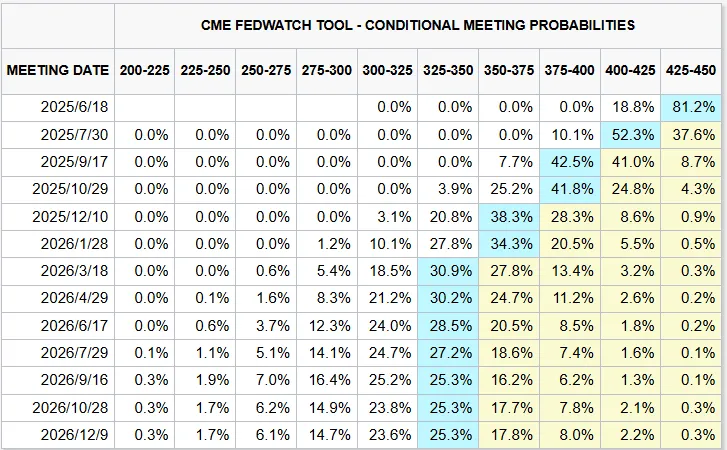
- The June meeting will be reassessed, and the March dot plot (two interest rate cuts within the year) has not been updated. The market expects the probability of a rate cut in June to drop to 23.2%.
1. Economic Health:
- The Beige Book shows negative sentiment (layoffs, rising prices, delayed investment), but hard data (consumption, credit card use) remain healthy.
- The correlation between soft data (sentiment) and hard data (spending) is weak, consumer confidence is pessimistic but spending continues, supporting the wait-and-see strategy.
IV. Market and Policy Outlook
1. Fed strategy:
- The May meeting sent a cautious wait-and-see signal, waiting for clarity on tariff policies and confirmation of economic data.
- With economic resilience and data support, the Federal Reserve maintains policy flexibility and independence.
2. Expectations of interest rate cuts:
- FedWatch shows that the probability of a rate cut in June has dropped from 30.4% to 23.2%, and a three-point rate cut is still expected for the whole year.
- After the 90-day tariff suspension expires (early July), economic data may decline, and July may be a window for interest rate cuts.
- It is expected that the interest rate will be cut by 2 to 3 basis points this year, and the tariff impact in the second half of the year may drag down GDP to less than 1% (New York Fed estimate).
3. Economic data support:
- Employment: The three-month average growth rate of non-farm and ADP employment was moderate (154,000 and 98,000).
- Consumption: In Q1 2025, GDP personal consumption expenditure increased by 1.8% quarter-on-quarter on an annualized basis.
- Inflation: CPI and PCE slowed down in March, oil price was $60 per barrel, and the low base pressure eased in April.
- The economy remained strong in the first half of the year due to the effect of pulling goods, but we need to pay attention to the impact of tariffs in the second half of the year.
V. Conclusion
The Federal Reserve kept interest rates unchanged at the May FOMC meeting, emphasizing the challenges of tariff policy uncertainty to the dual mission and adopting a "wait-and-see" strategy. Balance sheet reduction continues to slow down, and liquidity needs to pay attention to changes in debt ceilings and reserves. Powell reiterated that economic resilience supports waiting, and the timing of interest rate cuts depends on tariff progress and data, which will be reassessed at the June meeting. It is recommended to pay attention to economic data after the tariff suspension expires in July, and a 50~100bps interest rate cut is still possible this year.
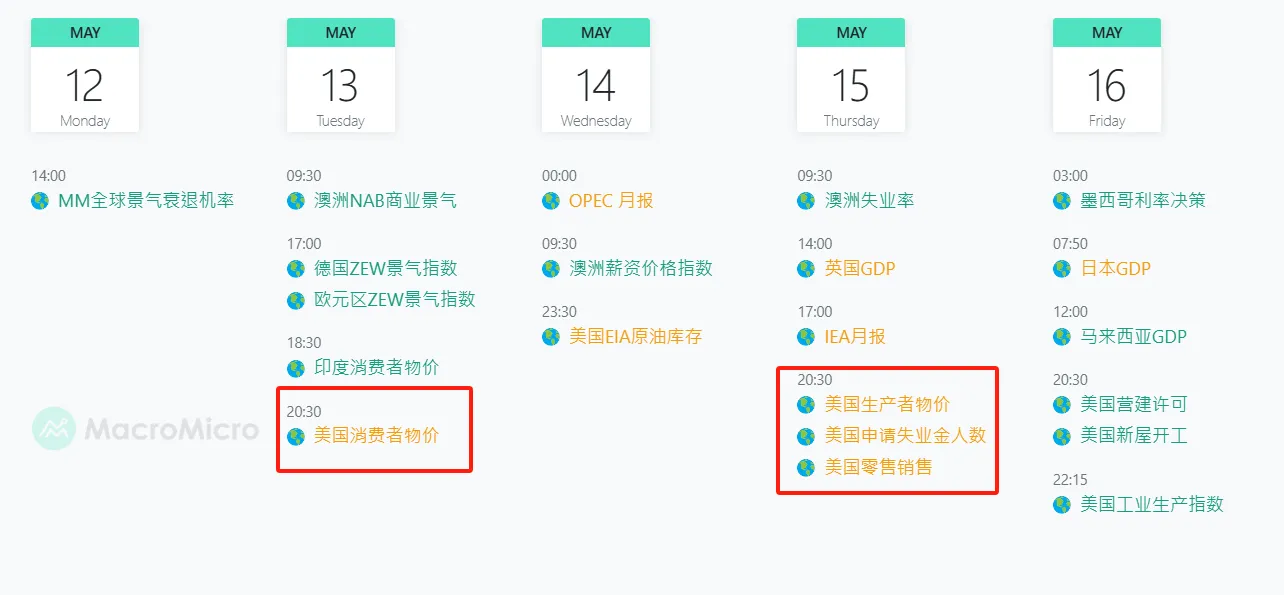
Key data to watch next week
2. On-chain data analysis
1. Changes in short- and medium-term market data that affect the market this week
1.1 Stablecoin Fund Flow
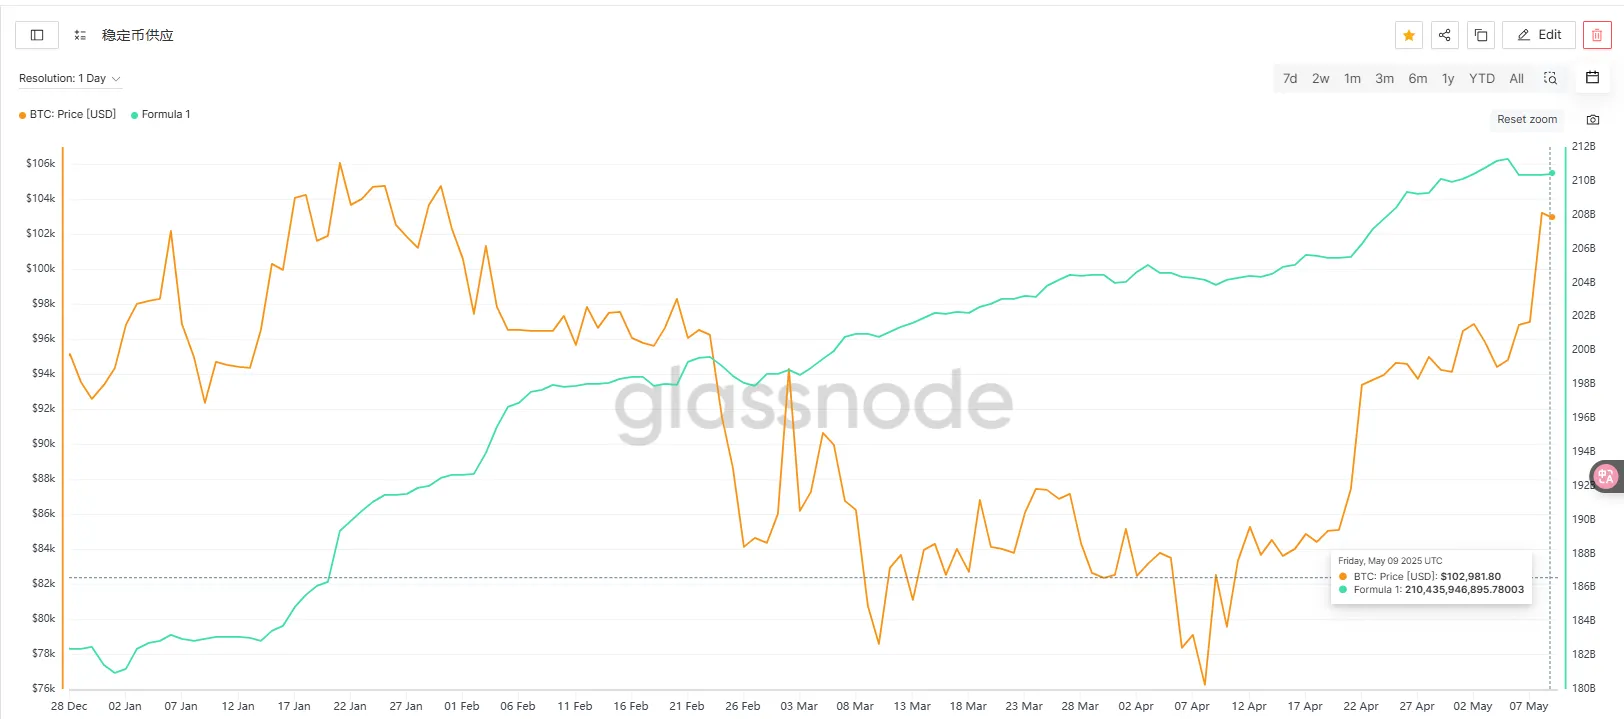

During the period of 4/25–5/8, the total amount of stablecoins increased to 210.379 billion, and the single-cycle issuance reached 2.549 billion, the highest in the past four weeks, indicating that the inflow of funds on the chain is still strong. However, the average daily issuance volume has slightly dropped from the previous period (from 310 million to 196 million). Although the short-term pace has slowed down, the issuance rate is still in the medium range. Overall, the continued issuance of stablecoins constitutes a medium-term positive, providing liquidity support for risky assets. Although the short-term momentum has weakened, the capital structure is still conducive to the subsequent market development.
Risk asset price support strengthens
The issuance of stablecoins is usually linked to the entry of investors. This amount of capital inflow provides liquidity support for Bitcoin, Ethereum and altcoins. The market generally interprets this as increased buying power and short-term benefits.
Speculative sentiment remains but cools down slightly
Although the total issuance volume hit a new high, the daily average issuance volume has declined, which may reflect that speculators' short-term enthusiasm has cooled slightly, or that major funds are waiting and watching. Combined with the recent market trend, if prices fail to rise synchronously, it may indicate that funds are waiting for clearer signals to enter the market.
The medium-term bullish structure is not broken
The overall total amount of stablecoins and weekly net increase trend are still on the rise, indicating that funds are still pouring into the on-chain market, which is one of the prerequisites for the market to maintain a volatile upward trend.
1.2 ETF Fund Flow
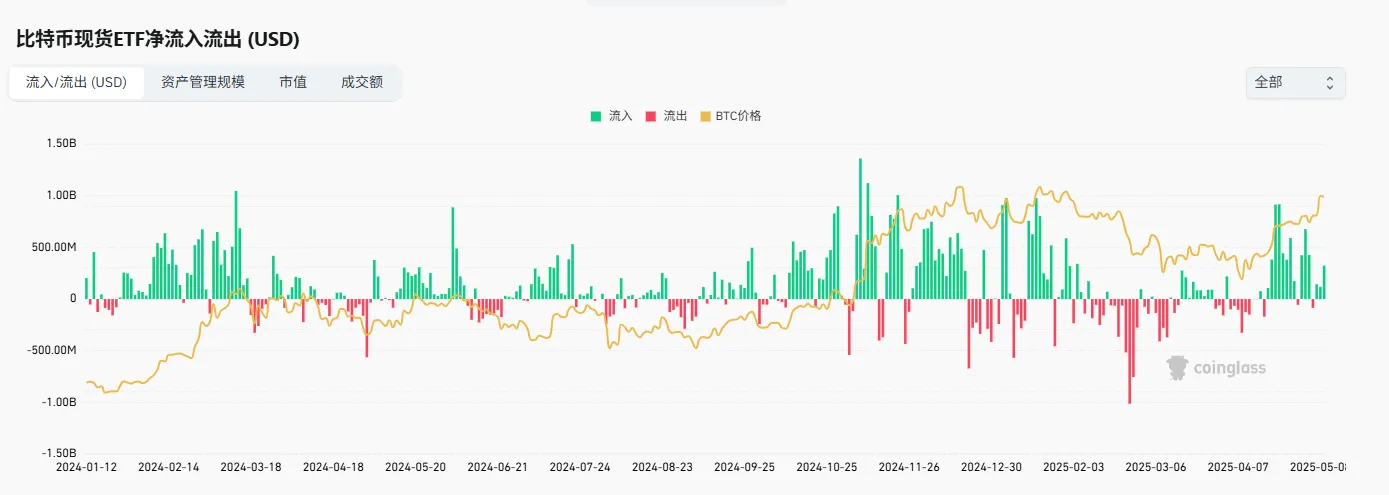

In the past four weeks, ETF fund flows have shown a rhythm of "rapid warming-peak decline". This week's inflow was only US$919 million, far less than the high level in late April, indicating that institutional funds have become cautious after the price surge. This shows that the current price increase has gradually deviated from the actual fund support and is more driven by market sentiment and technical momentum. Overall, the marginal slowdown of ETF funds has led to a lack of strong support for the rise. The market is transitioning from the "inflow-driven period" to the "expectation game period". Short-term volatility may increase, and attention should be paid to whether the fund side can regain its initiative.
Short-term rise lacks sustained financial support
Despite the price increase, the slowdown in ETF inflows indicates a lack of new strong buying in the market. If there is a lack of fundamental stimulus in the future (such as favorable policies or strengthening of macro easing expectations), BTC prices may enter a period of volatility or even a technical correction.
Institutional buying shifts from active to passive
The decline in inflows may reflect that institutions have turned to wait-and-see at high levels, or that some funds have already taken profits and left the market. This is a typical manifestation of the transition from a trend strengthening period to a consolidation period. The significant shrinkage after the peak, coupled with the price hitting a new high but weak trading, requires vigilance that a potential top structure is forming.
1.3 OTC Discounts and Premiums

This week, the OTC premiums of USDT and USDC continued to fall and fell into the underwater range, showing an abnormal performance that deviated from the BTC price trend. BTC continued to rise to near its historical high, but the OTC premium fell simultaneously, reflecting the weakening willingness of funds to enter the market, and the market showed more "passive holding" or "taking advantage of the situation to exit" mentality. This inverse structure of "price increase and premium decrease" indicates that short-term risks are accumulating. Investors need to be alert to potential liquidity ebb and price correction pressure, especially in the environment of weakening ETF inflows and slowing on-chain issuance. Stablecoin discounts may become an early signal of declining market momentum.
1.4 URPD
Let's take a look at the recent on-chain chip structure diagram. On April 19, the chip volume was 9.75w and transferred significantly to 8.45w. As of the 9th, the chip peak rebounded to 9.3w. Combined with the market performance, BTC encountered resistance near 9.78w and fell back to 9.3w, and then rushed up to 10.4w. It seems that the on-chain chips have a certain support and resistance effect on the market. At present, the first major support level on the chain is around 9.3w, and the second major support is around 8.45w.
2. Changes in mid-term market data that affect the market this week
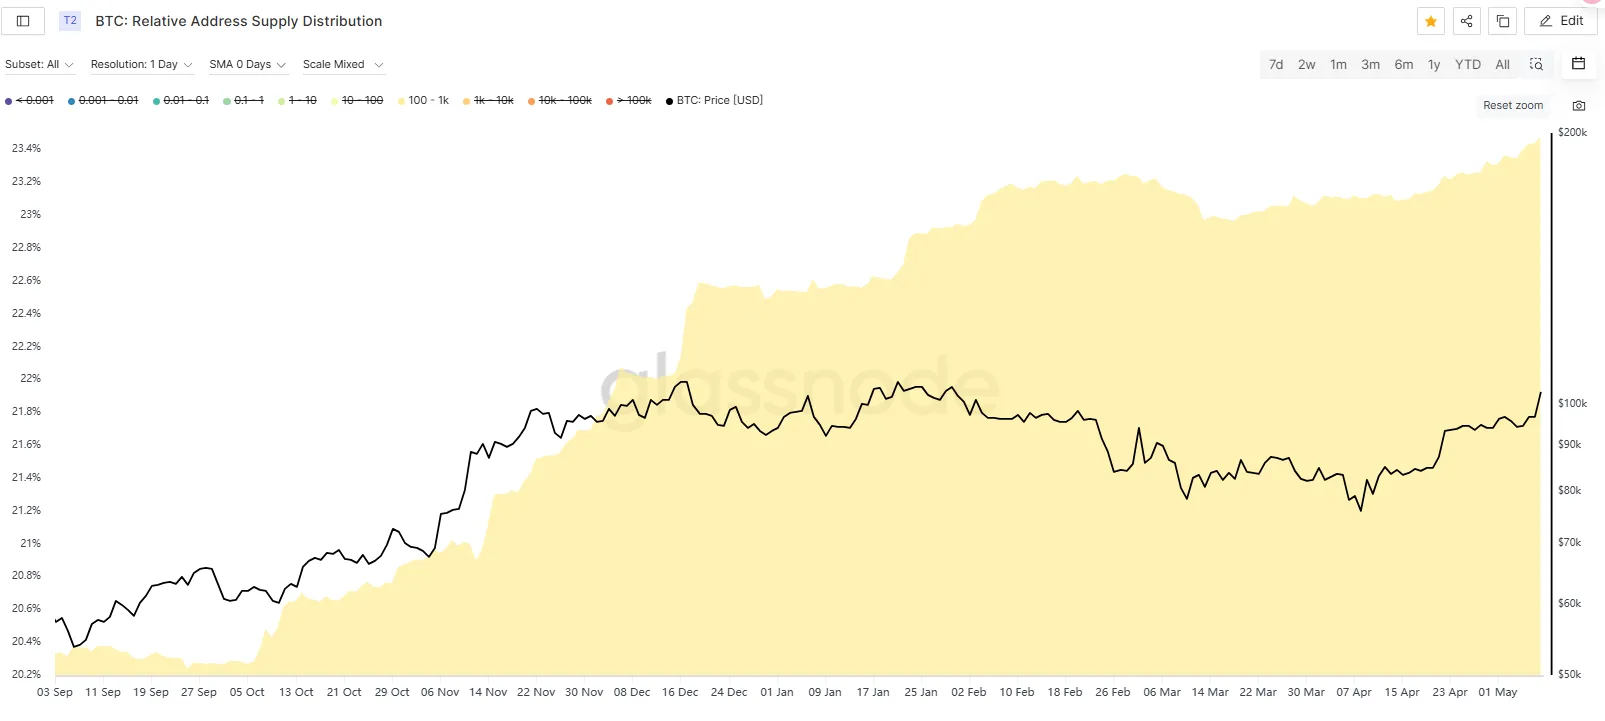
2.1 Proportion of coins held by coin holding addresses
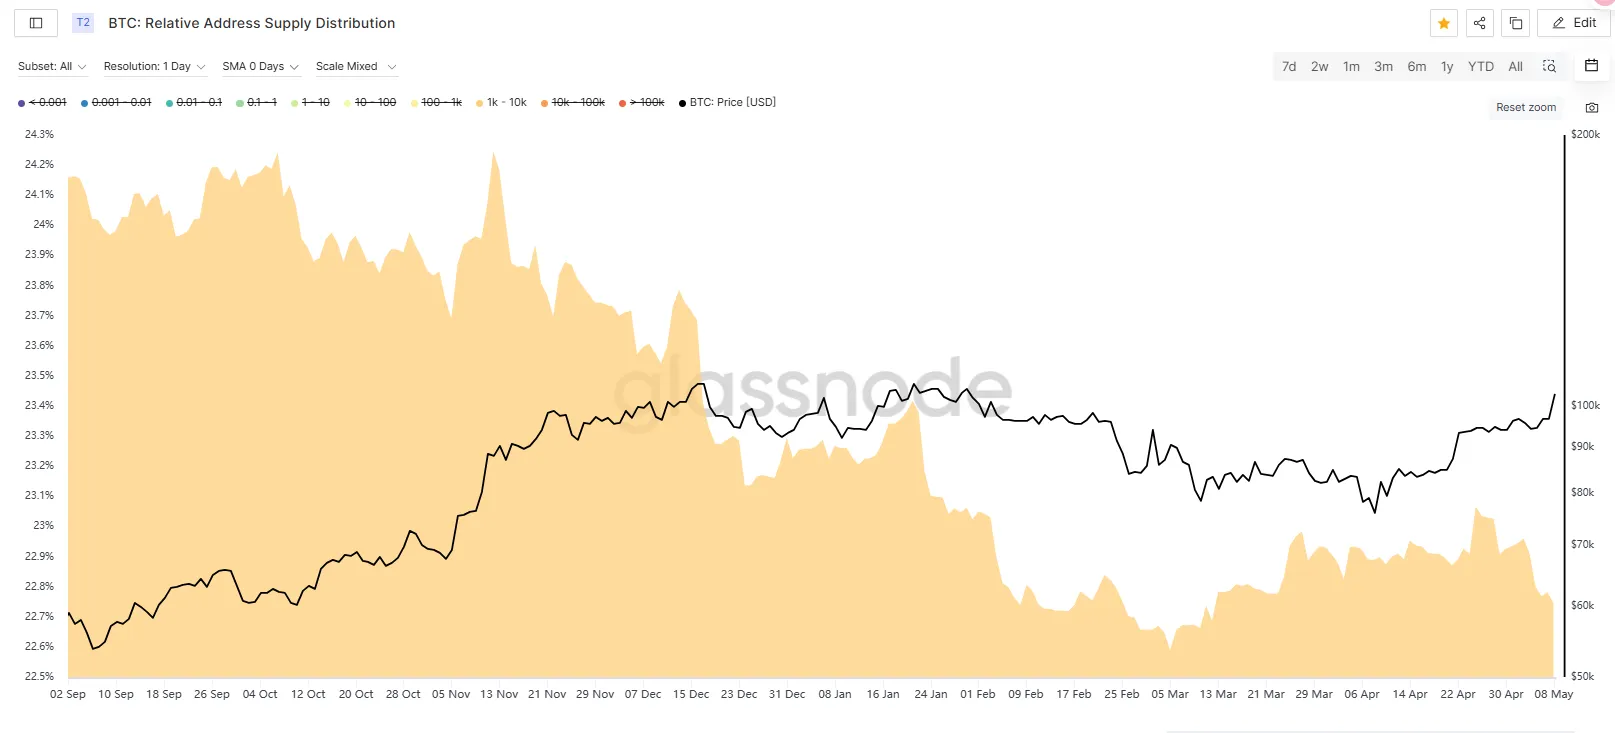
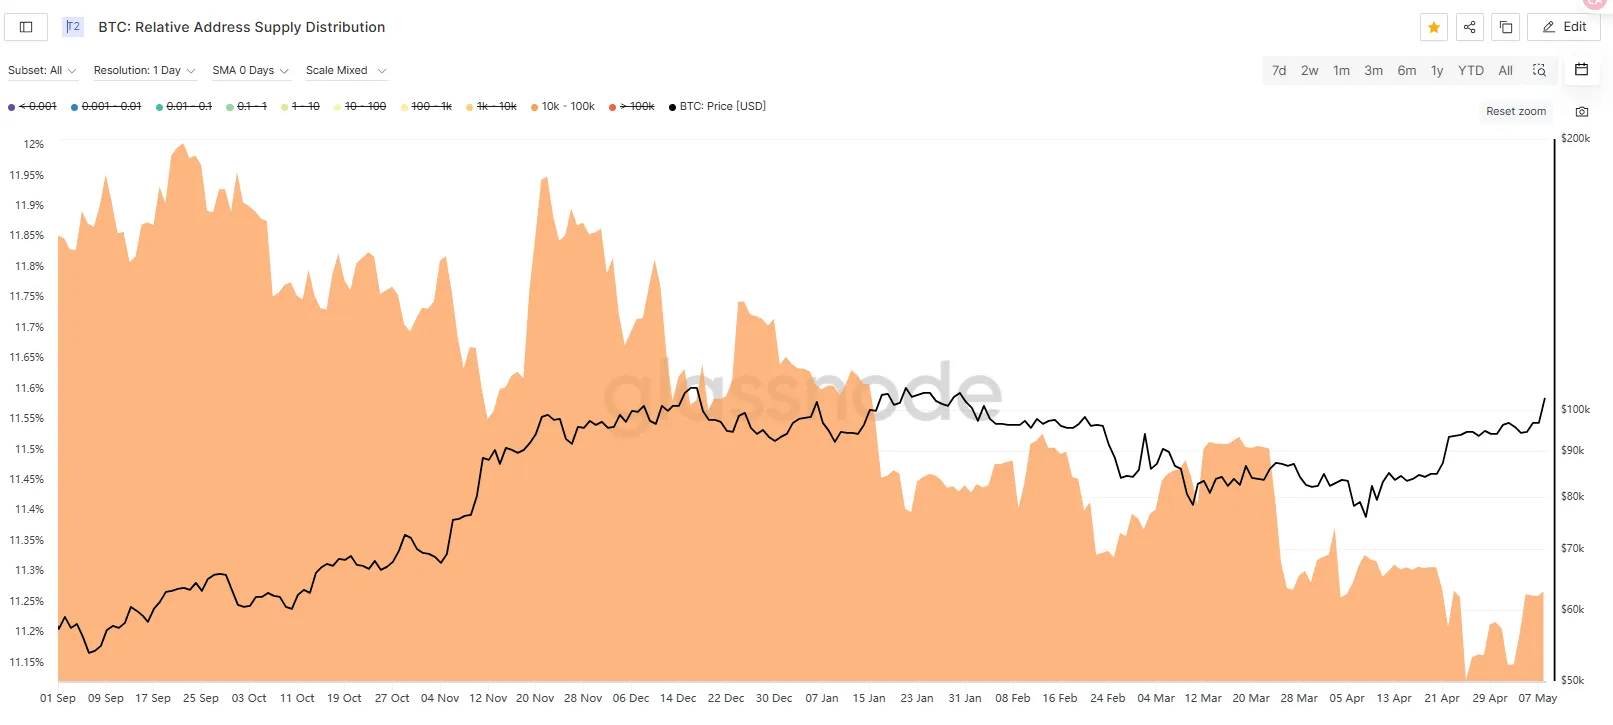
This week, the BTC on-chain holding structure showed the characteristics of "middle-level accumulation, large-scale reduction, and whale return": 100-1k BTC addresses increased by 0.14%, indicating that medium-sized funds continued to increase their holdings; 1k-10k BTC addresses decreased by 0.2%, which may reflect that some large-scale holders reduced their holdings or funds were dispersed; 10k-100k BTC addresses increased slightly by 0.12%, which may be due to large-scale funds buying back at low prices. Overall, the chips are being distributed to the middle-level addresses, and the on-chain structure is becoming healthier, which is conducive to the stable development of the medium-term market.
2.2 Market Pattern Analysis
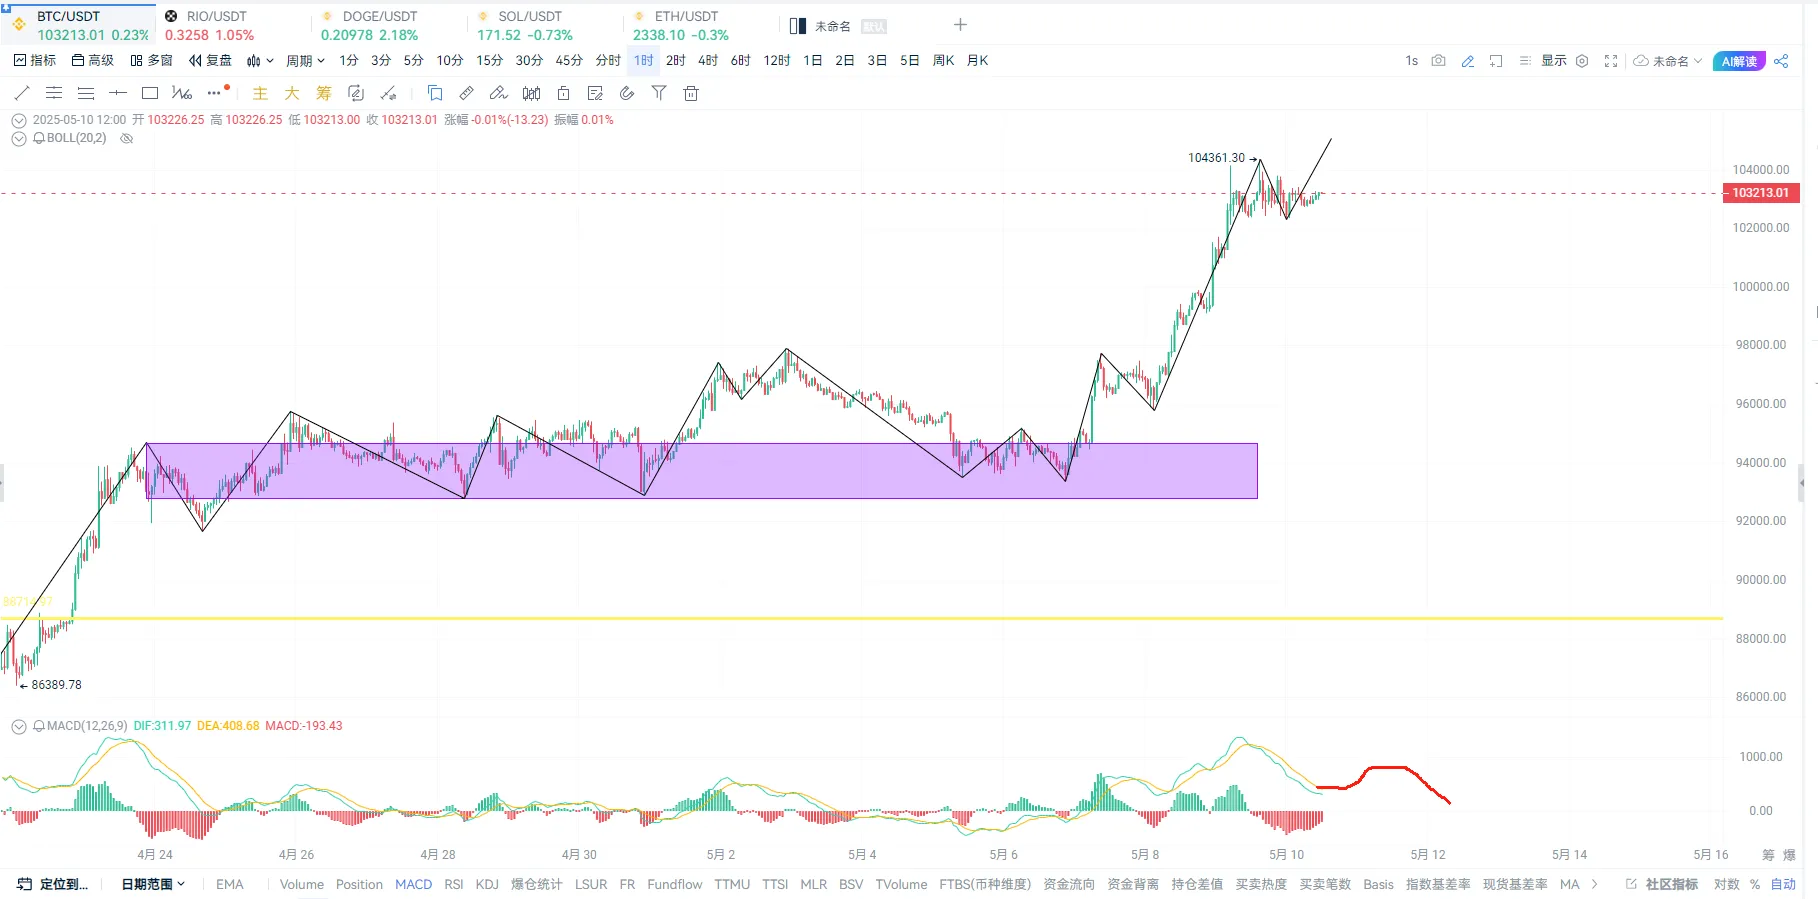
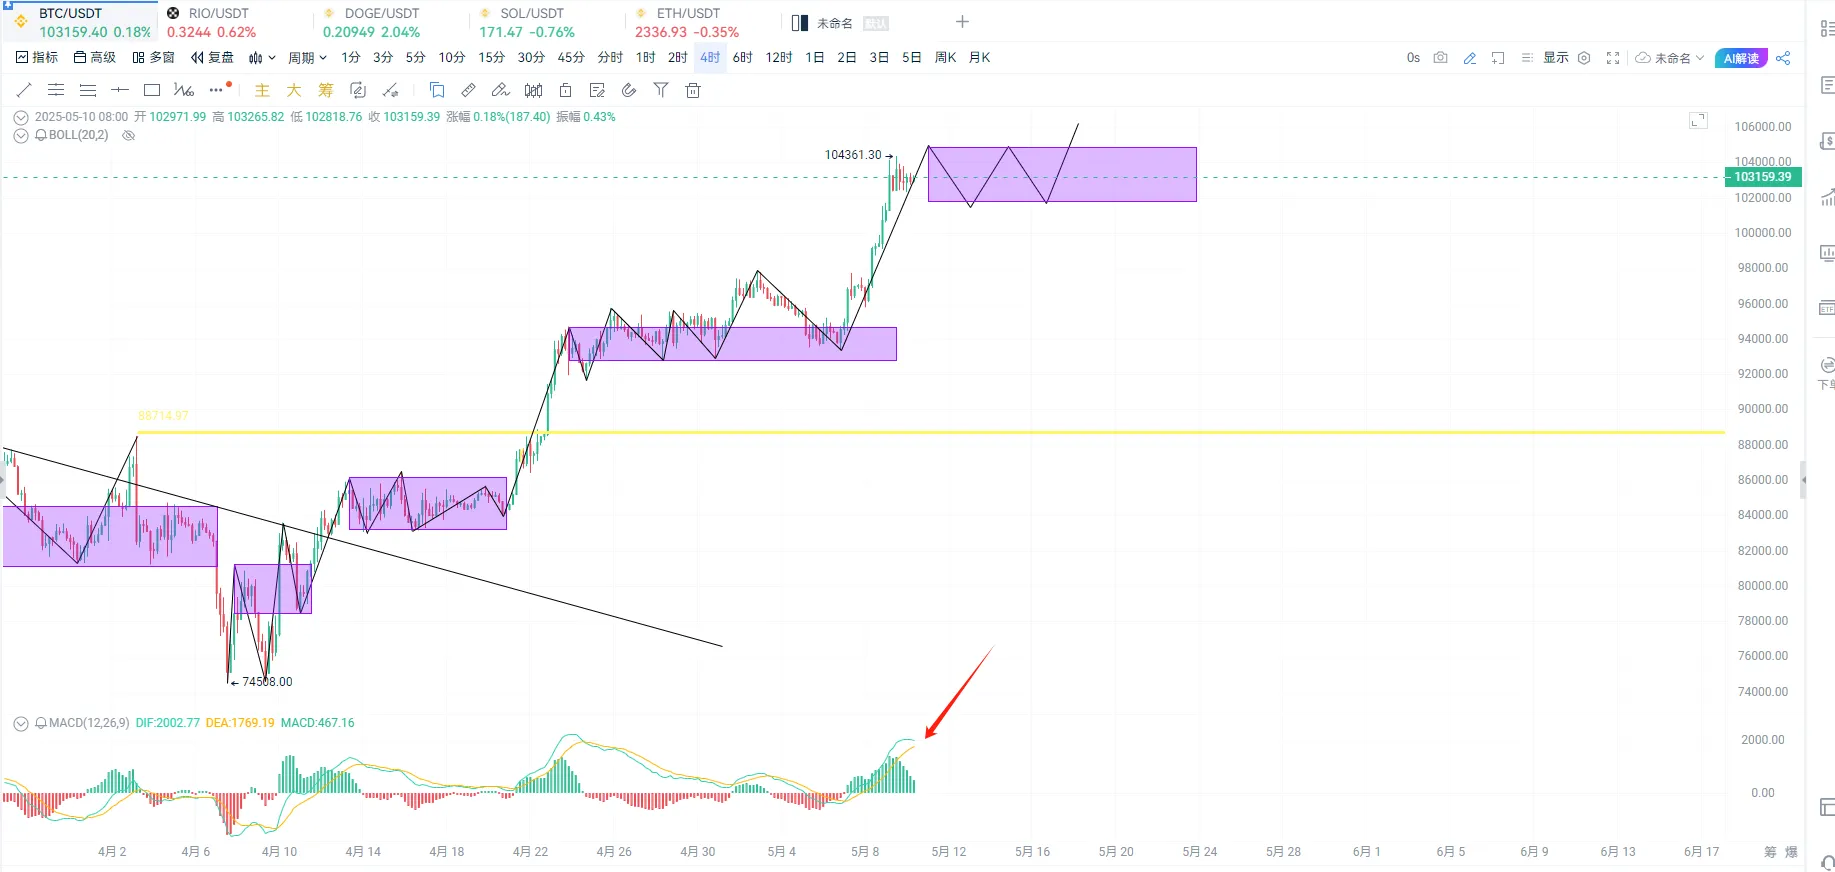
From the one-hour level (Figure 1), the indicator is about to be repaired and there is a possibility of further upward surge. We need to be alert to the pullback caused by the divergence after the upward surge to 10.4w, which may lead to a death cross of the four-hour indicator (Figure 2). We need to pay attention to the support near 10w below. It will oscillate between 10w-10.4w to repair the 4-hour indicator and then surge further.
Special thanks
Creation is not easy. If you need to reprint or quote, please contact the author in advance for authorization or indicate the source. Thank you again for your support.
Written by: Sylvia / Jim / Mat / Cage / WolfDAO
Edited by: Punko / Nora
Thanks to the above partners for their outstanding contributions to this weekly report. This weekly report is published by WolfDAO for learning, communication, research or appreciation only.


