The price of Bitcoin once again broke through $94,000, and altcoins followed suit. Behind this wave of market trends, has the on-chain data released a bull market signal? By analyzing key indicators such as transaction volume, user behavior, and currency distribution, we can see the market trend from the underlying logic.
Trading volume and market heat
Data source: bitsCrunch.com
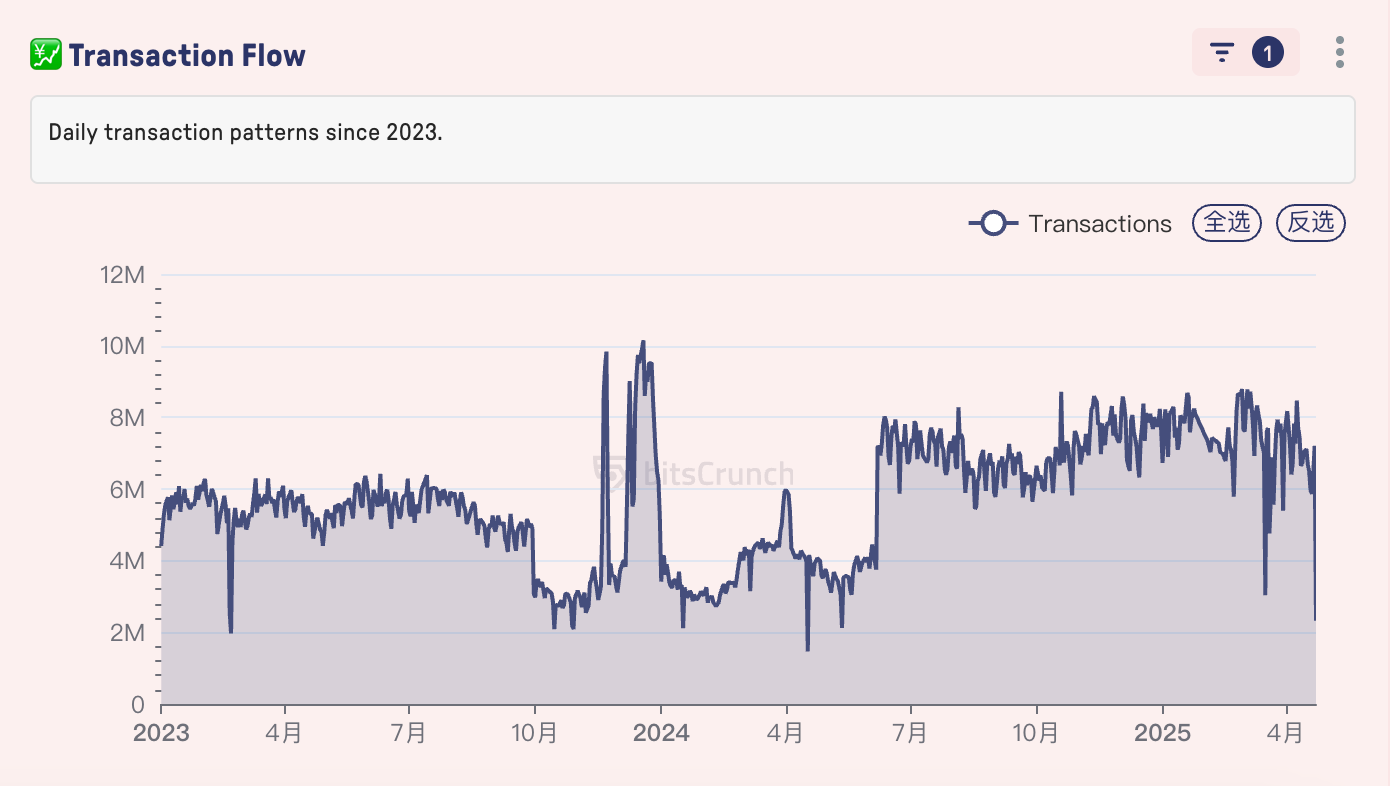
According to bitsCrunch data, in the past 24 hours, the total transaction volume of the entire network reached 39.9 billion US dollars, the number of transactions exceeded 7.2 million times, the number of independent addresses participating in the transaction was 3.03 million, and 13,800 tokens were involved. Since July 2023, the transaction volume has continued to climb from the bottom 2M to 10M, especially after April 2024, the growth rate has accelerated, and the market liquidity has significantly increased. Although the number of on-chain transactions dropped sharply in March this year, it has generally shown a short-term upward trend.
Trader Structure
Data source: bitsCrunch.com
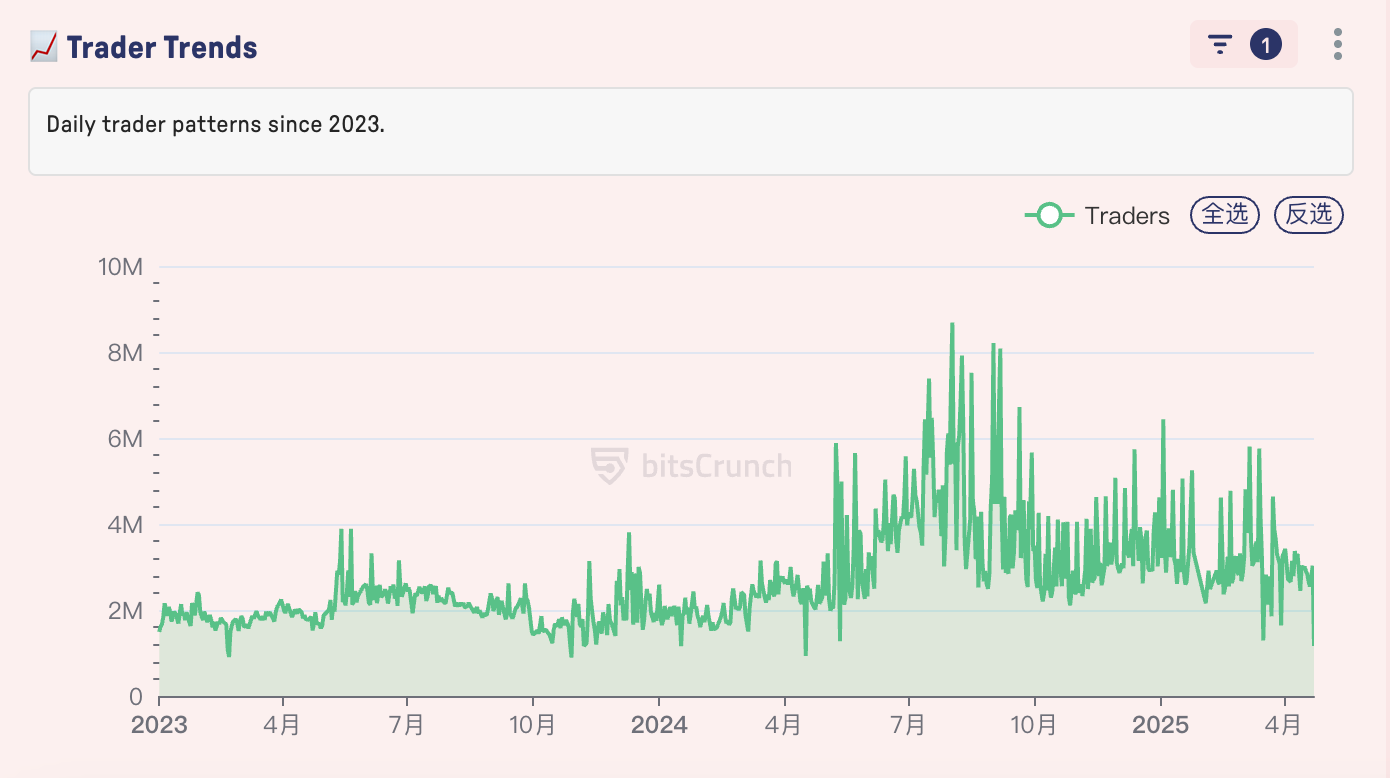
The trader trend chart reveals the fluctuations in the number of on-chain traders since 2023. According to bitsCrunch data, in October 2023, the number of traders fell below 2M, but quickly rebounded to 8M in the second half of 2024 and remained at a relatively high point in January 2025. This change is highly consistent with the "recovery-outbreak" stage of the market cycle. It is worth noting that the growth in the number of traders is not linear, and there are short-term pullbacks in each quarter (such as May and August). The figure also shows the periodic adjustment of the sentiment of institutional investors and retail investors by explosive news. However, the current number of 3.03M daily active traders is still at a relatively low point, only one-third of the peak period, and further observation is needed.
On-chain token holdings distribution
Data source: bitsCrunch.com
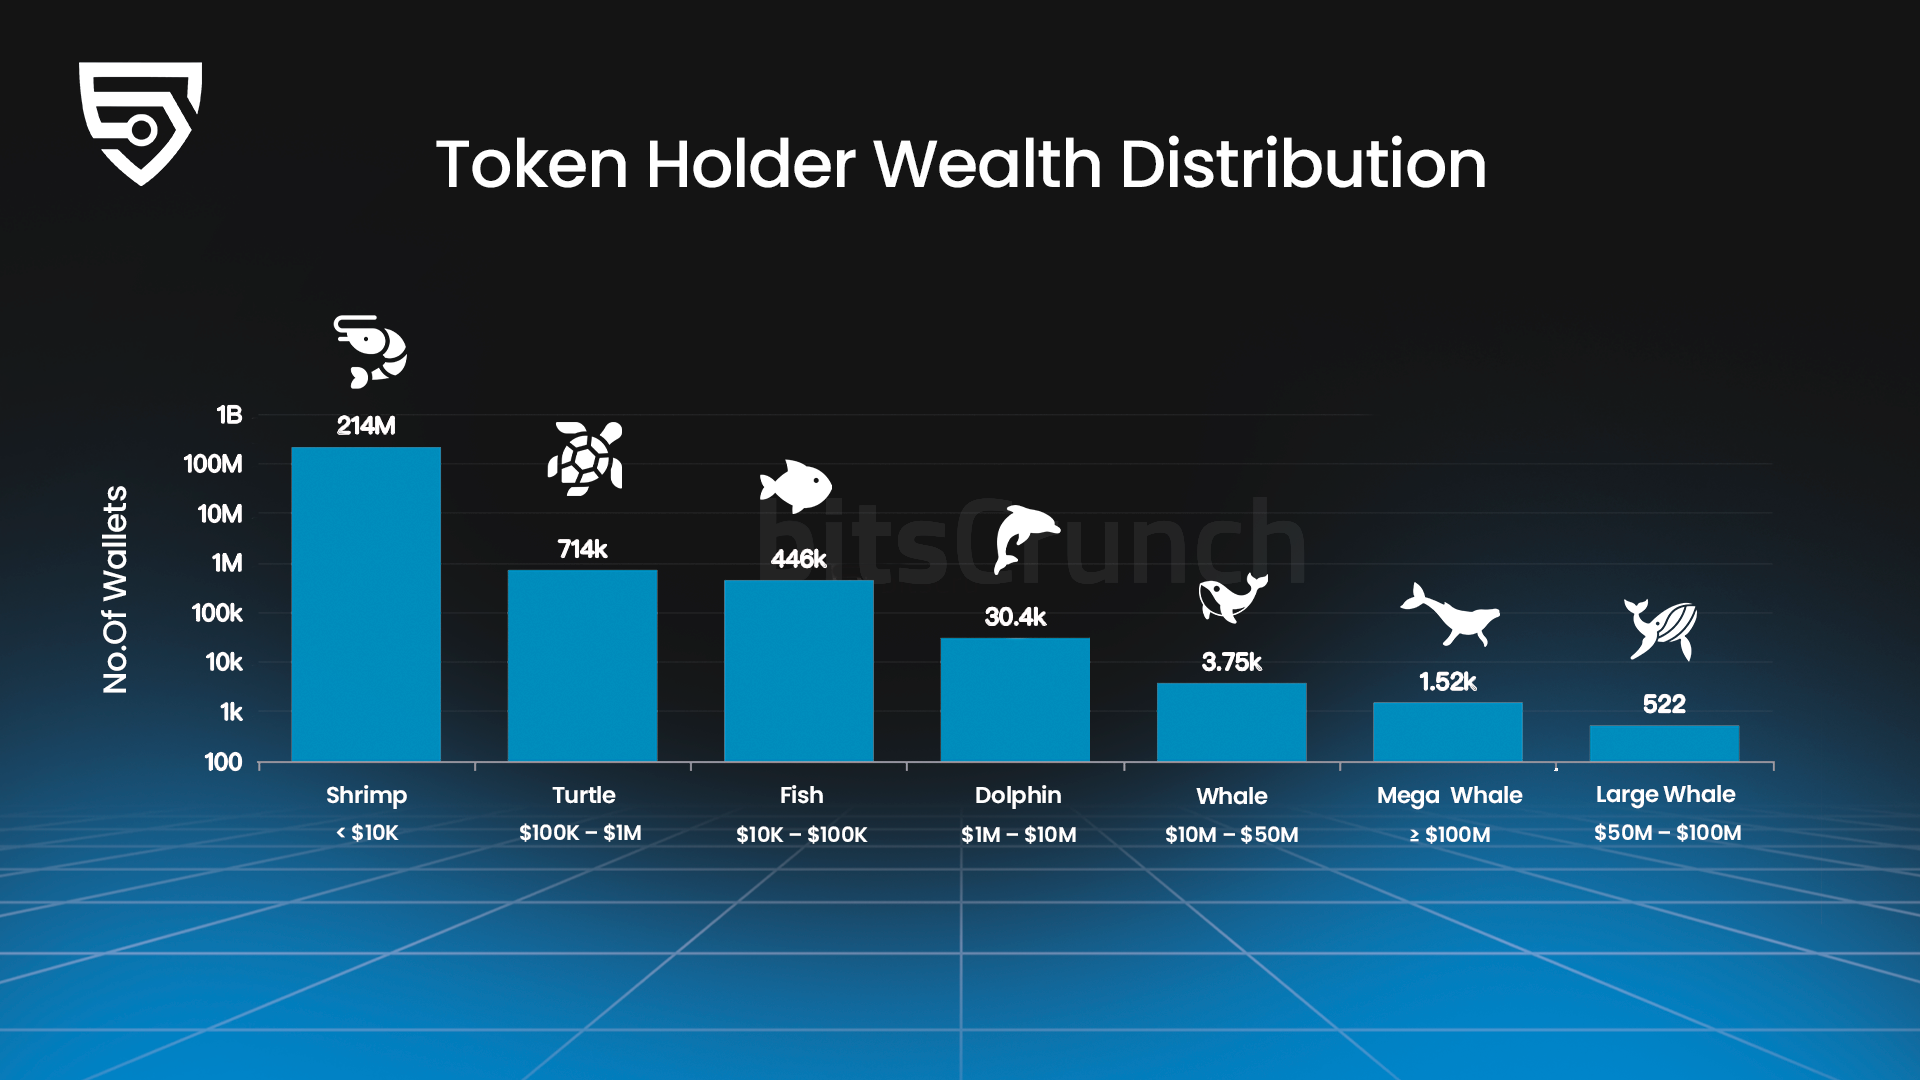
Among the above traders, bitsCrunch further classifies wallet addresses according to different holding amounts. At present, there are 1,052 "Mega Whale" wallets holding assets exceeding $100 million. Although the number of retail wallets (Shrimp, <$10,000) accounts for the absolute majority, about 214M, the overall amount is far less than that of giant whales. This "28 split" is particularly typical in the financial market - giant whales often enter the market first to absorb funds, and then small and medium-sized funds follow up to push up asset prices. It is worth noting that the number of wallets at the "Dolphin" (1M-10M) and "Fish" (10K-100K) levels also provide key support for market liquidity.
Token Ecosystem Analysis
Data source: bitsCrunch.com
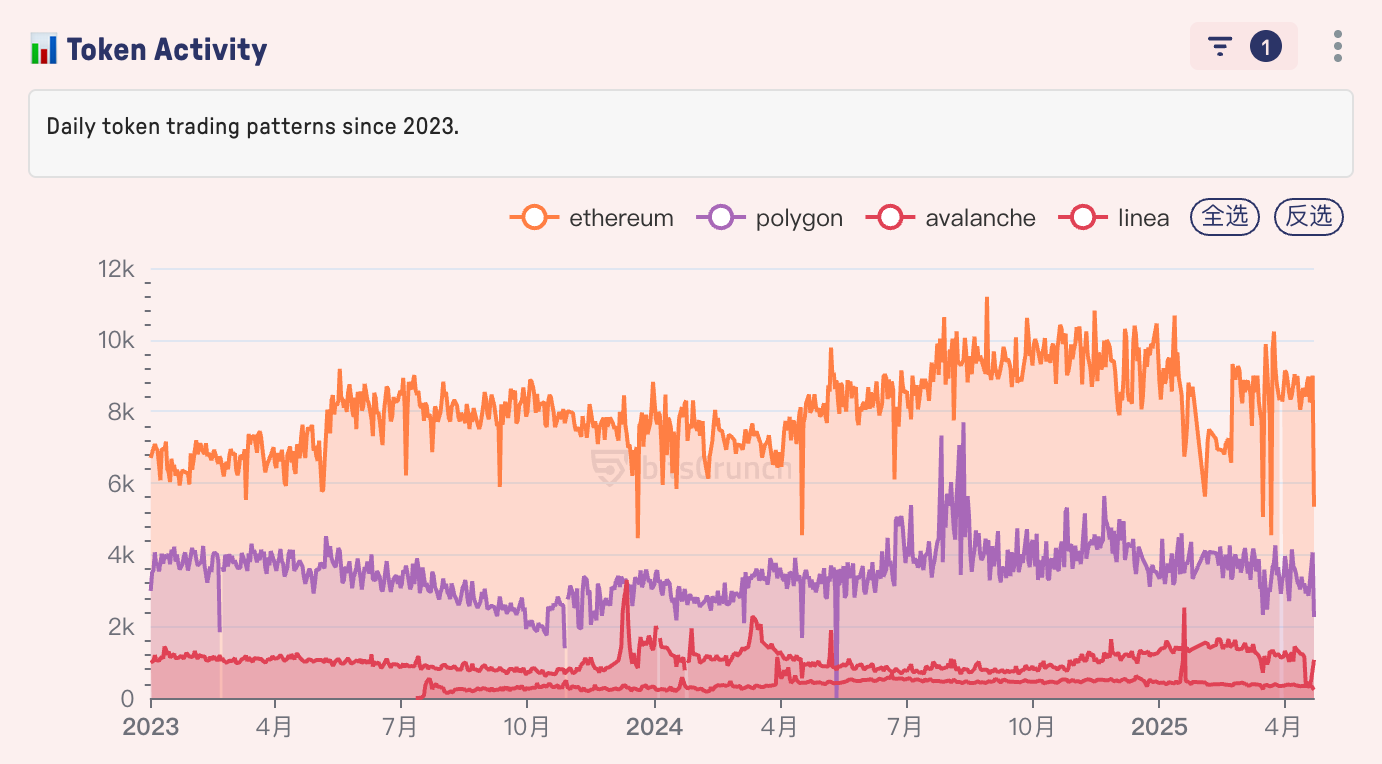
As can be seen from the above figure, Polygon on-chain transactions are relatively stable, with daily transactions stable at around 4K. It is worth noting that according to bitsCrunch Ethereum on-chain data, at the beginning of 2025, Ethereum on-chain transactions had already fallen sharply, while the price reflection was even more lagging. With the launch of more Layer1, the decline in the activity of the Ethereum ecosystem may reshape the market structure.
Conclusion
Although Bitcoin has returned to 90,000 and many altcoins have seen impressive gains, the on-chain transaction volume has not returned to a relatively active level in the current market. With the parallel development of news policies and regulations in 2025, the structure of on-chain traders has become more diversified, with whales and retail investors being active simultaneously. Even with new hot spots and tracks, investors still need to pay attention to marginal changes in data, remain rational in a frenzy market, and pay attention to tracking the actions of whales to avoid short-term selling pressure that may be caused by the high concentration of capital distribution.