With the intensification of macro-negative factors and capital outflow, the crypto market will continue to fluctuate downward in the short term, and structural opportunities will focus on BTC-dominated, RWA, and re-staking sectors.
- The short-term structure is weak, and the market may maintain a volatile downward pattern (key range: 7.6w - 8.5w), and we still need to guard against breaking below 7.45w.
- Medium-term perspective: If the interest rate cut and QE expectations are fulfilled and geopolitical tensions ease, it may drive altcoins and mainstream currencies to resonate upward.
1. Macro and market environment
Risk aversion rises as global trade war intensifies
On April 2, 2025, the United States announced a 10% tariff increase globally, especially targeting countries with trade deficits, triggering a risk aversion trend in the market:
- U.S. stocks and crypto markets: under pressure and moving downward simultaneously, liquidity is under pressure.
- Economic expectations: Inflation expectations are strengthening, the economy is slowing down, and recession expectations are rising.
- Strategic recommendations: Asset allocation should be defensive, with an appropriate long position in volatility and a focus on safe-haven assets (such as gold and long-term government bonds).
Monetary policy shifts to stronger expectations
The CPI data in March fell significantly (core CPI YoY 2.8%, MoM 0.1%), reinforcing the market's expectations for a rate cut in June. The US dollar came under short-term pressure and gold rose.
2. Analysis of capital flows & market structure of mainstream currencies
External Funding Flows
- ETF funds: Net outflow this week was US$707 million, with large outflows for two consecutive weeks, the largest in recent months; indicating strong risk aversion among institutions.
- Stablecoins: Net redemption of US$460 million, ending three consecutive weeks of net issuance, and risk appetite for funds declined.
Market sentiment indicators
- OTC premium soared: the discount and premium levels rose rapidly to the historical pressure zone, and the attractiveness of short-term rebound increased, but it faced potential profit-taking pressure.
- MVRV: Short-term MVRV fell to 0.82, which is in the systemic loss area. Historically, this position is often the local bottom.
Bitcoin (BTC)
- Technical analysis: Structural rebound to 81,000, 84,500-88,700 range is the key resistance zone; if there is no breakthrough, it may retrace to test 74,500 support.
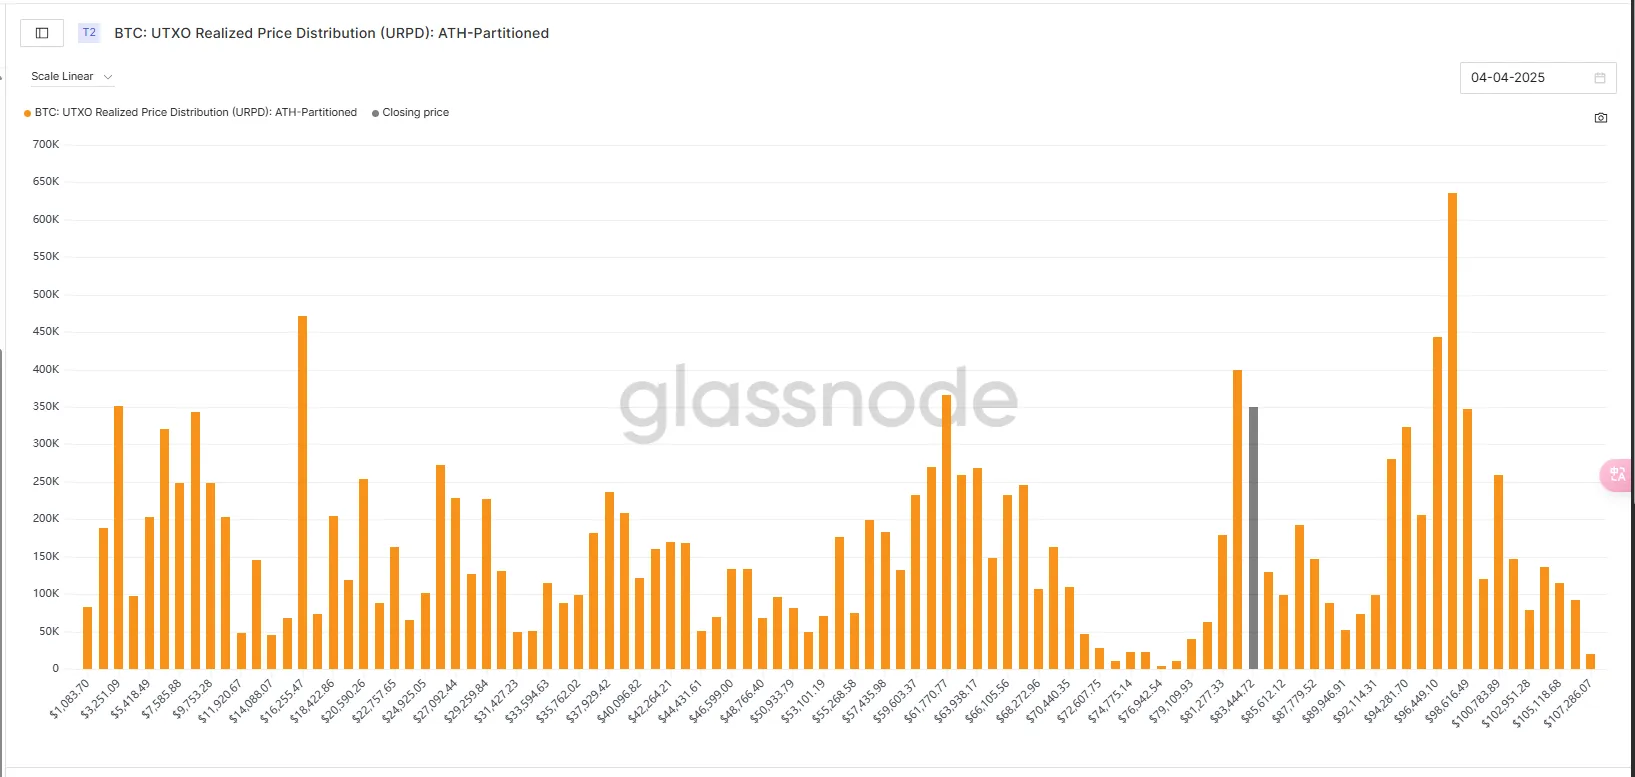
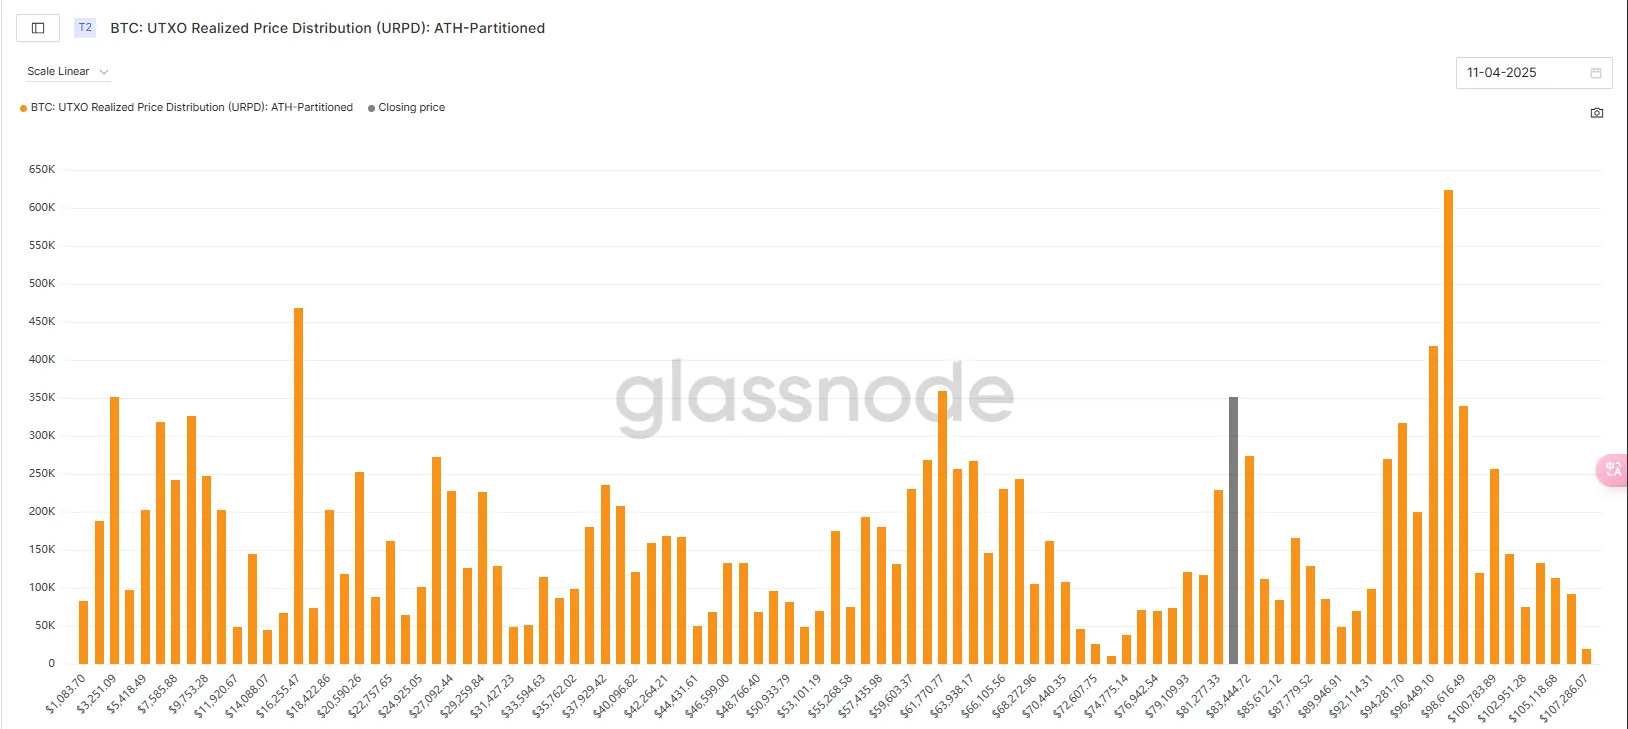
- On-chain chip distribution: The chip concentration area is between 82k-97k. If the price continues to rise, it will face significant selling pressure.
Ethereum (ETH)
- The trend is weaker than BTC. ETH/BTC maintained volatility and then broke down this week, and funds continued to flow back to BTC dominance.
- On-chain changes: The increase in active addresses may indicate that the staged bottoming out has been completed.
Macroeconomic Review
The impact of the trade war on US stocks and BTC
On April 2, 2025, the United States launched a global reciprocal tariff policy, imposing a 10% tariff on all trading partners and higher tariffs on countries with trade deficits, causing shock in global markets.
- Macro level: Global trade costs are rising, inflationary pressures are increasing, and economic growth is slowing.
- National level: Countries with trade deficits (such as the United States) are hit hard, and Asian countries with deeply integrated supply chains (such as Japan and South Korea) are also facing challenges.
- Market level: stock market fluctuations, exchange rate fluctuations, commodity prices are under pressure. The market begins to panic and decline
- Future trends: The market recovery depends on geopolitical easing and measures taken by various countries to stimulate the economy. If the negative factors gradually decrease, the cryptocurrency market and the US stock market are expected to ease the current pressure.
- Investment advice: Diversify investments, focus on safe-haven assets, and go long on volatility.
Data analysis
Fund Flow:
- Stablecoin fund flows: Stablecoins had a net redemption of 460 million this week, ending three weeks of issuance.
- ETF fund flows: ETF outflows of 707 million, the largest outflow in the past four weeks
- OTC discount and premium: Due to the sharp drop in BTC, short-term bottom-hunting sentiment is obvious, and the premium level has risen sharply
1. Macro Market Analysis
The impact of tariff implementation at different stages on the market

Future market trends and response strategies
1. Two key driving factors for future market trends
When is expected to recover:
- Depends on the progress of the US-China trade negotiations: If the two sides reach a compromise, market confidence may be restored. At present, we need to focus on China's countermeasures.
- Speed of global economic recovery: If major economies (such as the United States and the European Union) introduce stimulus policies, such as interest rate cuts and balance sheet expansion, the impact of the tariff war may be alleviated.
Drivers:
- Geopolitical détente: Improved relations between China and the United States could reduce trade barriers.
- Business adaptability: Businesses that successfully diversify their supply chains are likely to recover first.
2. Investor response strategies
- Diversification: Reduce over-reliance on risky market returns and invest in a diverse portfolio of assets.
- Focus on safe-haven assets: As market uncertainty increases, safe-haven assets such as gold and government bonds may become more attractive.
- Long-term perspective: focus on the long-term opportunities brought by supply chain reconstruction.
Probability of rate cut
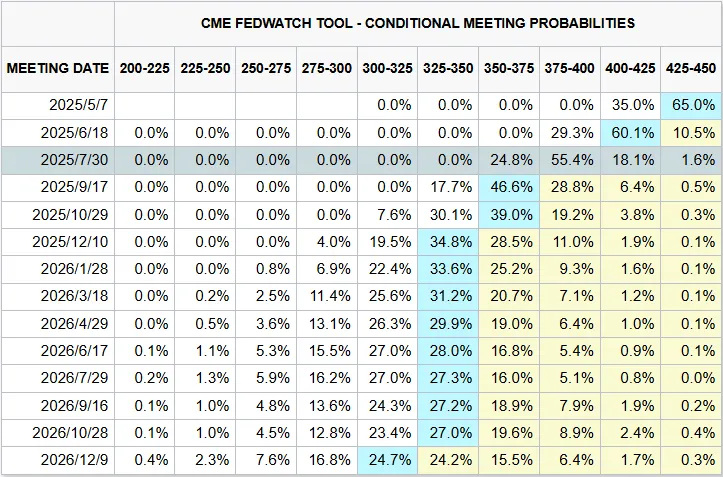
The U.S. core CPI annual rate in March was 2.8%, falling for the second consecutive month, the lowest level since March 2021, and lower than the market expectation of 3.0%. The U.S. core CPI monthly rate after seasonal adjustment in March was 0.1%, the lowest since June 2024, lower than the market expectation of 0.3%.
After the data was released, spot gold rose by $6 in the short term, the US dollar index fell by 20 points in the short term, and the pound sterling against the US dollar expanded its intraday gains to 1.00%. US short-term interest rate futures rose, and traders increased their bets on the Fed's interest rate cut. The market almost fully priced in the Fed's June interest rate cut.
Key data to watch next week

2. Data Analysis
1. Changes in short- and medium-term market data that affect the market this week
1.1 Stablecoin Fund Flow
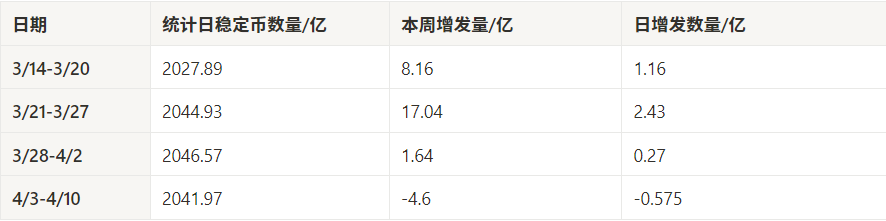
The number of stablecoins this week dropped from 204.657 billion last week to 204.197 billion, a decrease of 460 million, with net redemption. Negative issuance this week means that investors withdrew funds from the stablecoin market. The average daily decrease was -0.575 billion, a significant turnaround compared to the previous weeks, ending three consecutive weeks of net issuance.
1. Declining risk appetite
- Markets may face short-term uncertainties (such as changes in interest rate expectations, geopolitical events or policy impacts).
- Investors choose to withdraw funds from crypto assets and turn to fiat currency or other safe-haven assets.
2. Weakened trading demand
- As a medium of transaction, changes in the size of stablecoins usually reflect market activity.
- This week’s net redemptions may indicate a reduction in on-chain activity or leverage usage and a weakening of risk appetite.
3. Potential short-term adjustment signal
- If the supply of stablecoins continues to shrink, it may indicate that the market is about to enter a period of liquidity tightening or price consolidation.
- This could put slight downward pressure on prices, especially for high-beta assets that rely on stablecoin inflows.
1.2 ETF Fund Flow
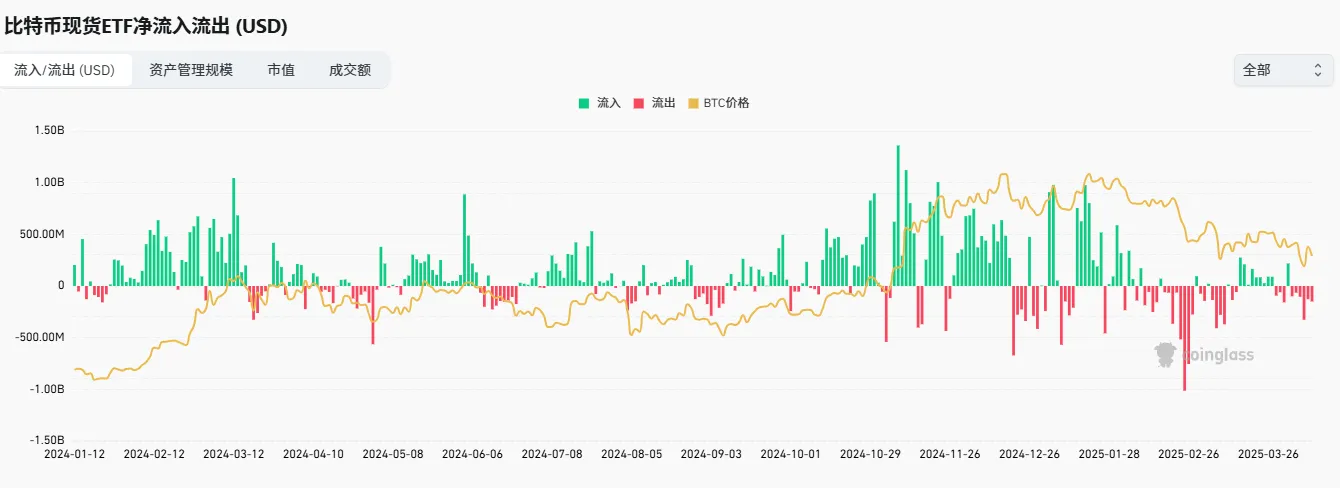
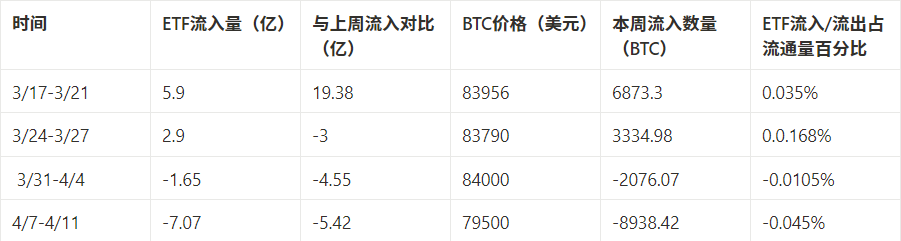
ETFs have experienced net outflows for two consecutive weeks, with net outflows reaching -US$707 million this week, the largest outflow in the past four weeks. Compared with the previous week, capital outflows expanded by nearly 328.5%, reflecting a clear wait-and-see attitude or panic selling by institutional investors.
1. Bitcoin prices continue to be under pressure
- The average price of BTC this week is $79,500, which has been falling from the mid-March high ($83,956);
- The outflow of funds is synchronized with the price drop, indicating that ETF liquidity has a direct suppressive effect on the spot market.
2. ETFs’ impact on market circulation intensifies
- ETFs are highly correlated with BTC prices, and continued outflows may cause market panic to expand;
- If this happens continuously, it may become a "structural pressure source" for the mid-term downward trend in the spot market. If the outflow slows down or turns positive next week, it may constitute an opportunity to repair oversold prices. Otherwise, it is still necessary to guard against the risk of further declines.
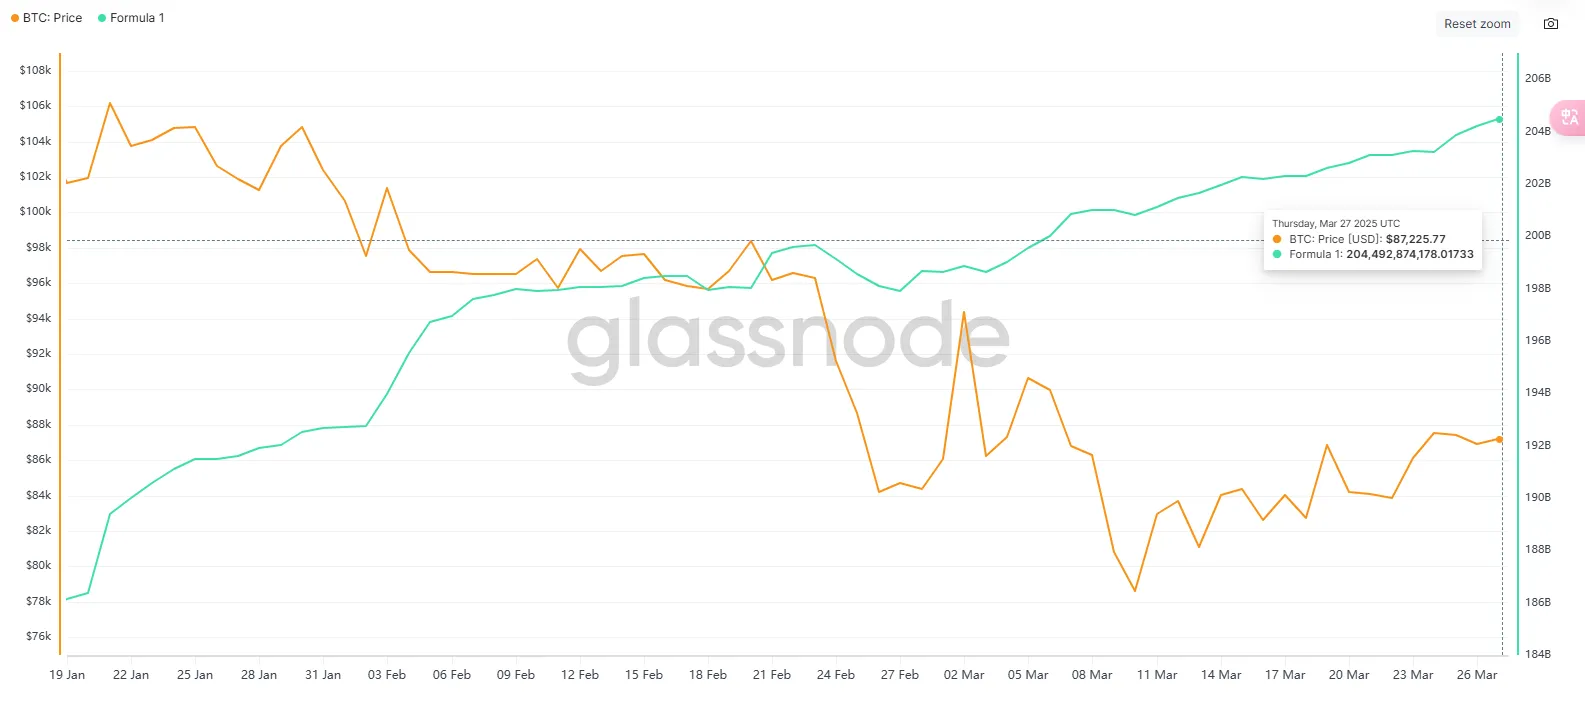
1.3 OTC Discounts and Premiums
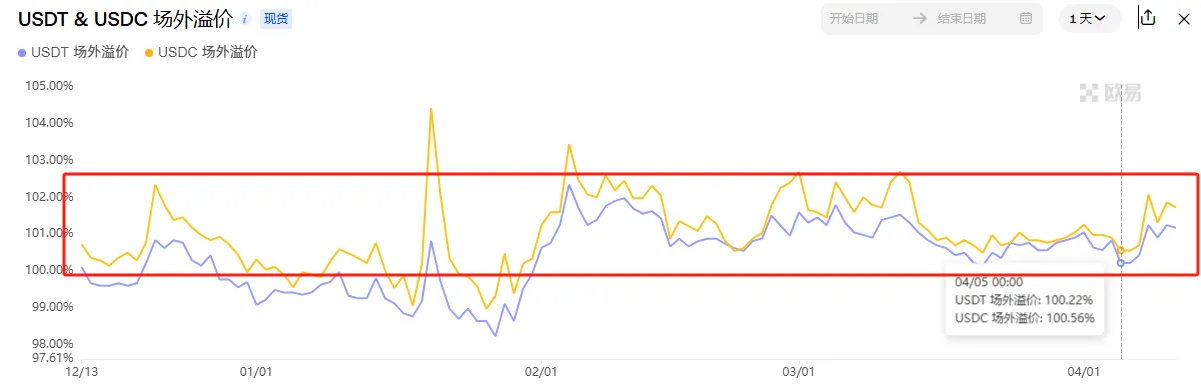
This week, the OTC premium and discount are on an upward trend and are about to reach the upper pressure range. The corresponding market performance is that the BTC price first reached 7.45w on April 7 and then rebounded to 8.35w on April 10. The rapid rise in premium also shows that the price of 7.45w is more attractive to investors in the short term. It should be noted that the premium is also about to reach the front pressure zone, which may usher in the profit-taking of short-term chips.
1.4 URPD
The left picture is the chip structure chart of BTC chain on April 4. Currently, a dense chip peak is forming near 82361, and the chips with 97532 as the center as the chip peak above are not in a state of rapid reduction due to fear of a sharp drop in prices and stop-loss chip peaks. At the same time, if the price runs to the upper range, 97532 as the center will be a relatively strong resistance level, and the market needs more time to digest it.
2. Changes in mid-term market data that affect the market this week
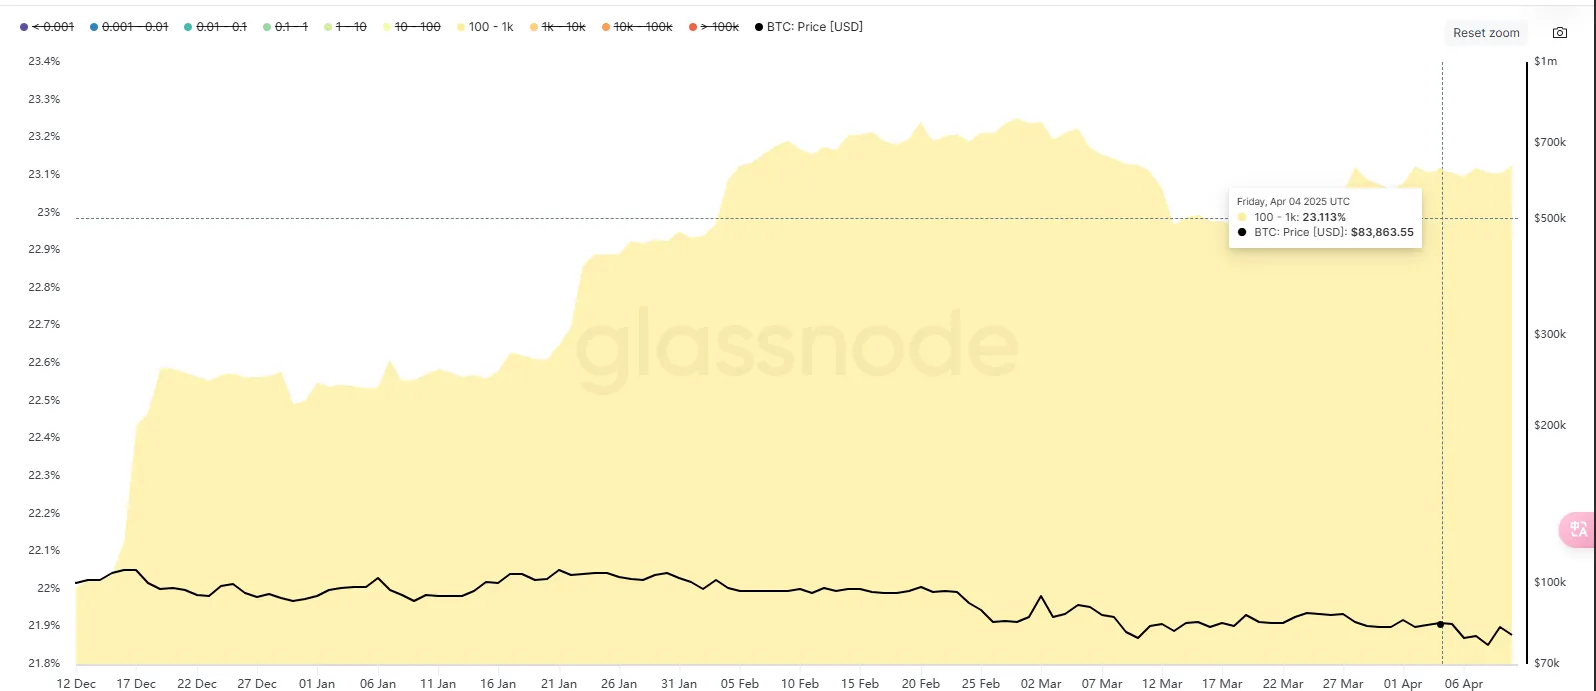
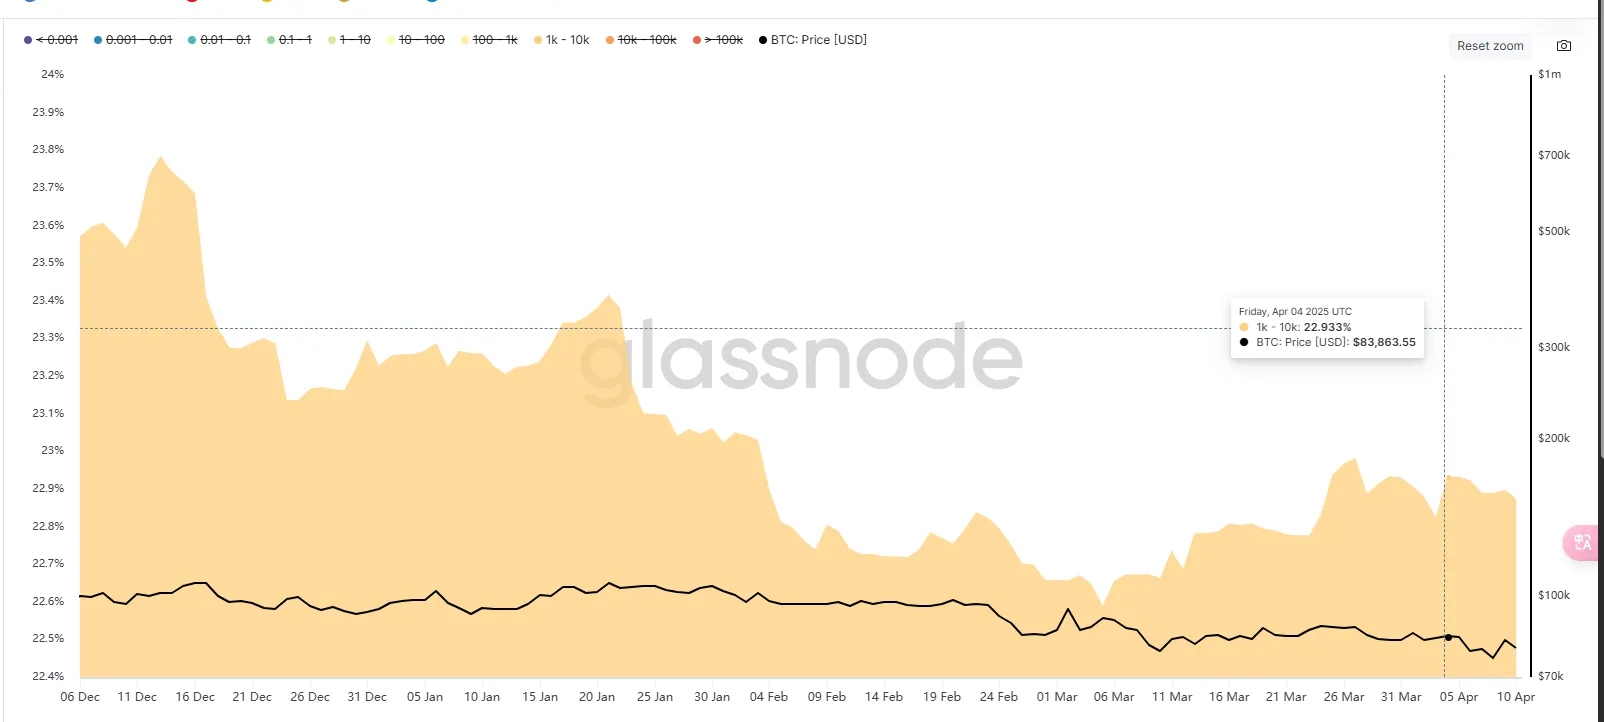
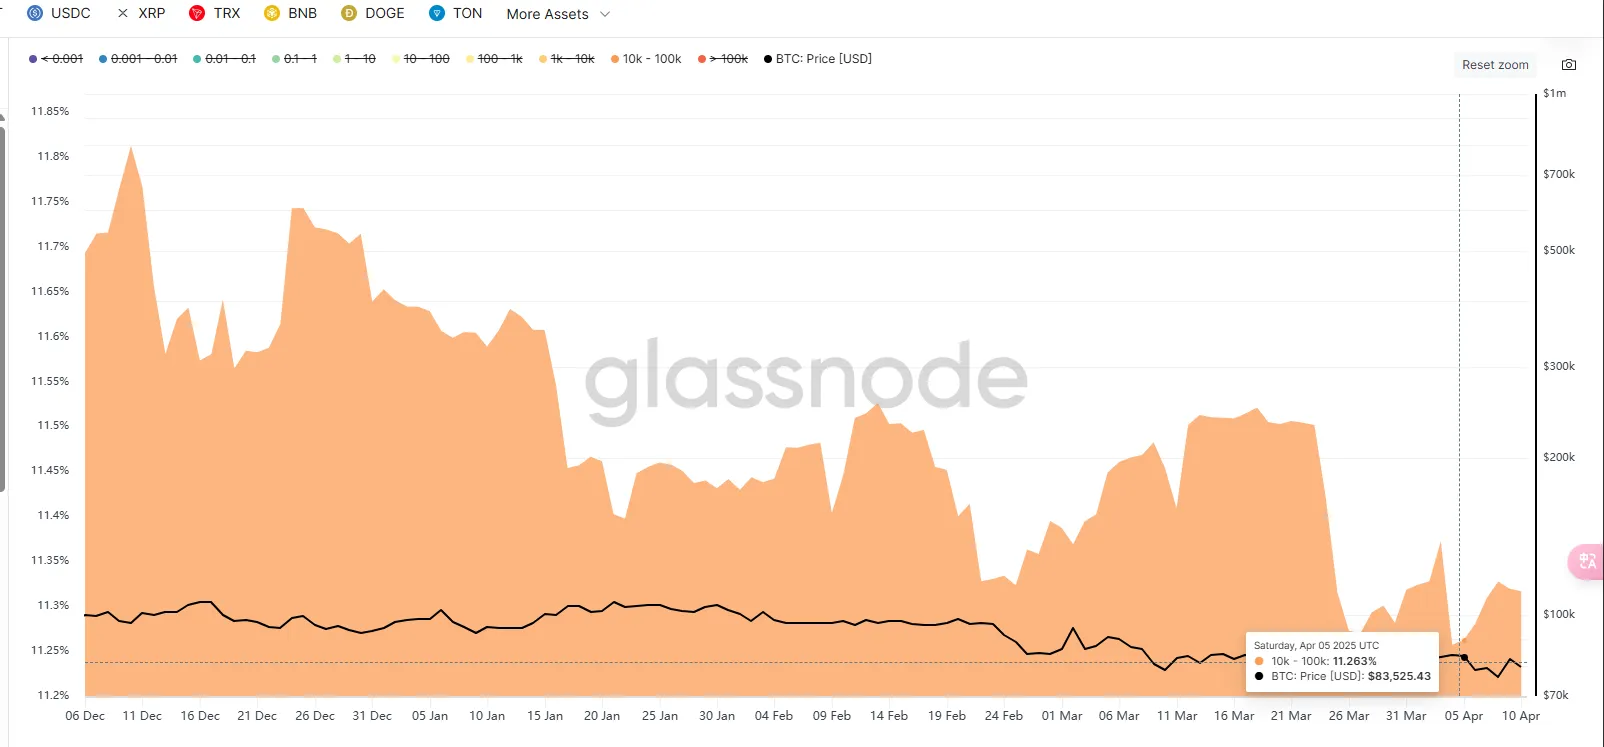
2.1 Proportion of coins held by coin holding addresses
This week, the number of coins held in the 100-1k and 1k-10k ranges did not change much, while the number of addresses in the 10k-100k range increased significantly, raising the level by 80,000. From the chart, we can see that this part of the chips is more sensitive to the market, and after avoiding this part of the decline, the chips were added back to the level before the decline.
2.2 Short-term chips-MVRV
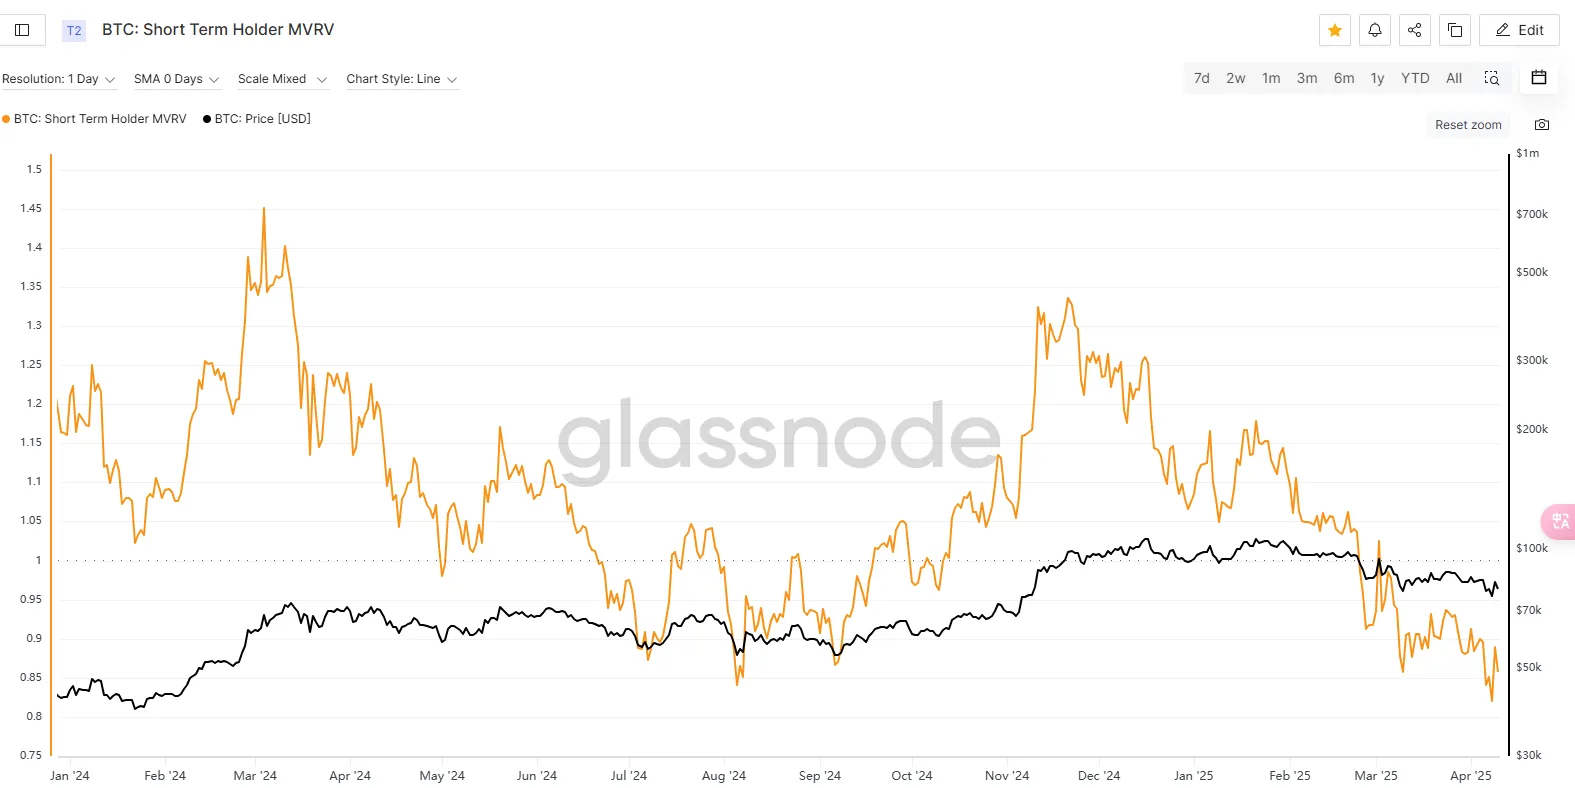
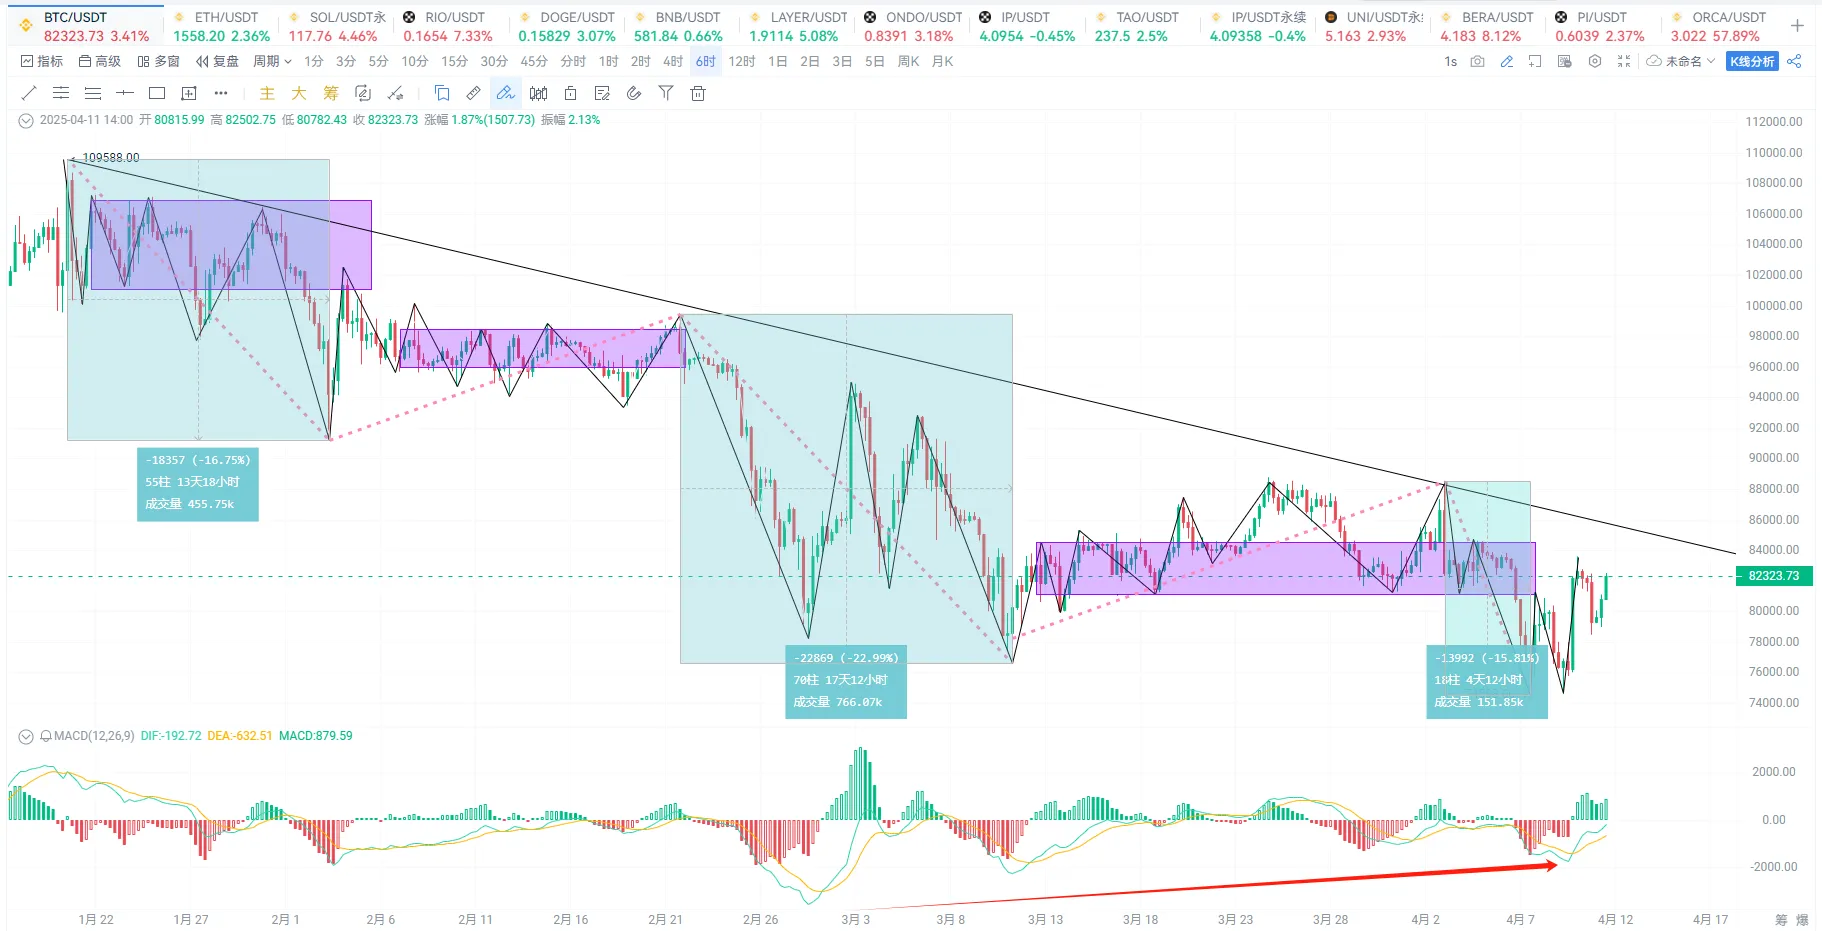
BTC's short-term coin holder MVRV indicator has fallen to around 0.82, hitting a new low since 2024 and has been below 1 for more than a month, indicating that the short-term market is in a systematic loss range. This stage often corresponds to the trading range of local lows. For example, from July to August 24, MVRV was below 1 for a month and then began a big rebound.
2.3 Market Pattern Analysis
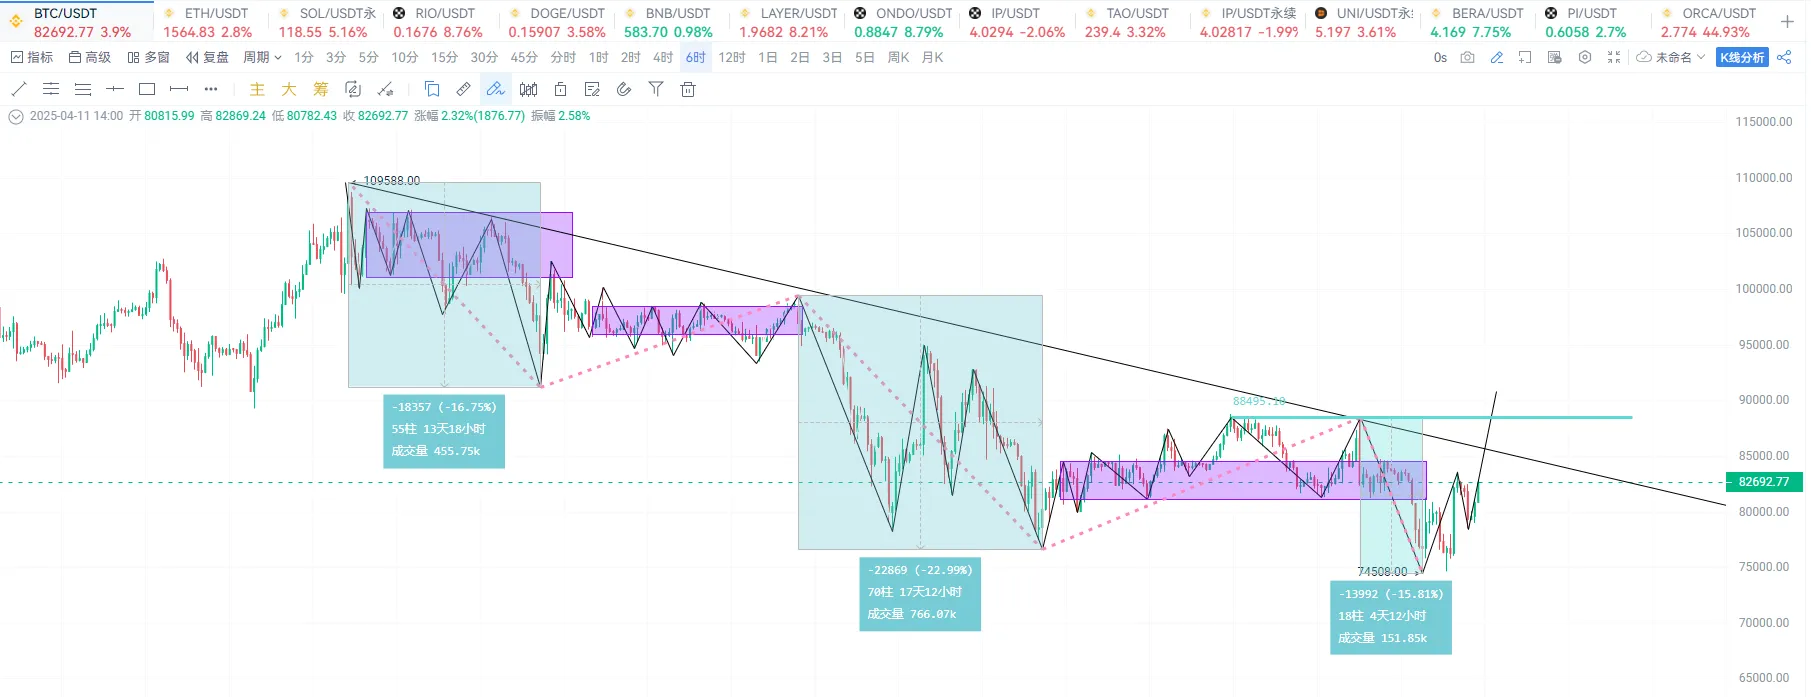
Analysis 1: 74508 is not low
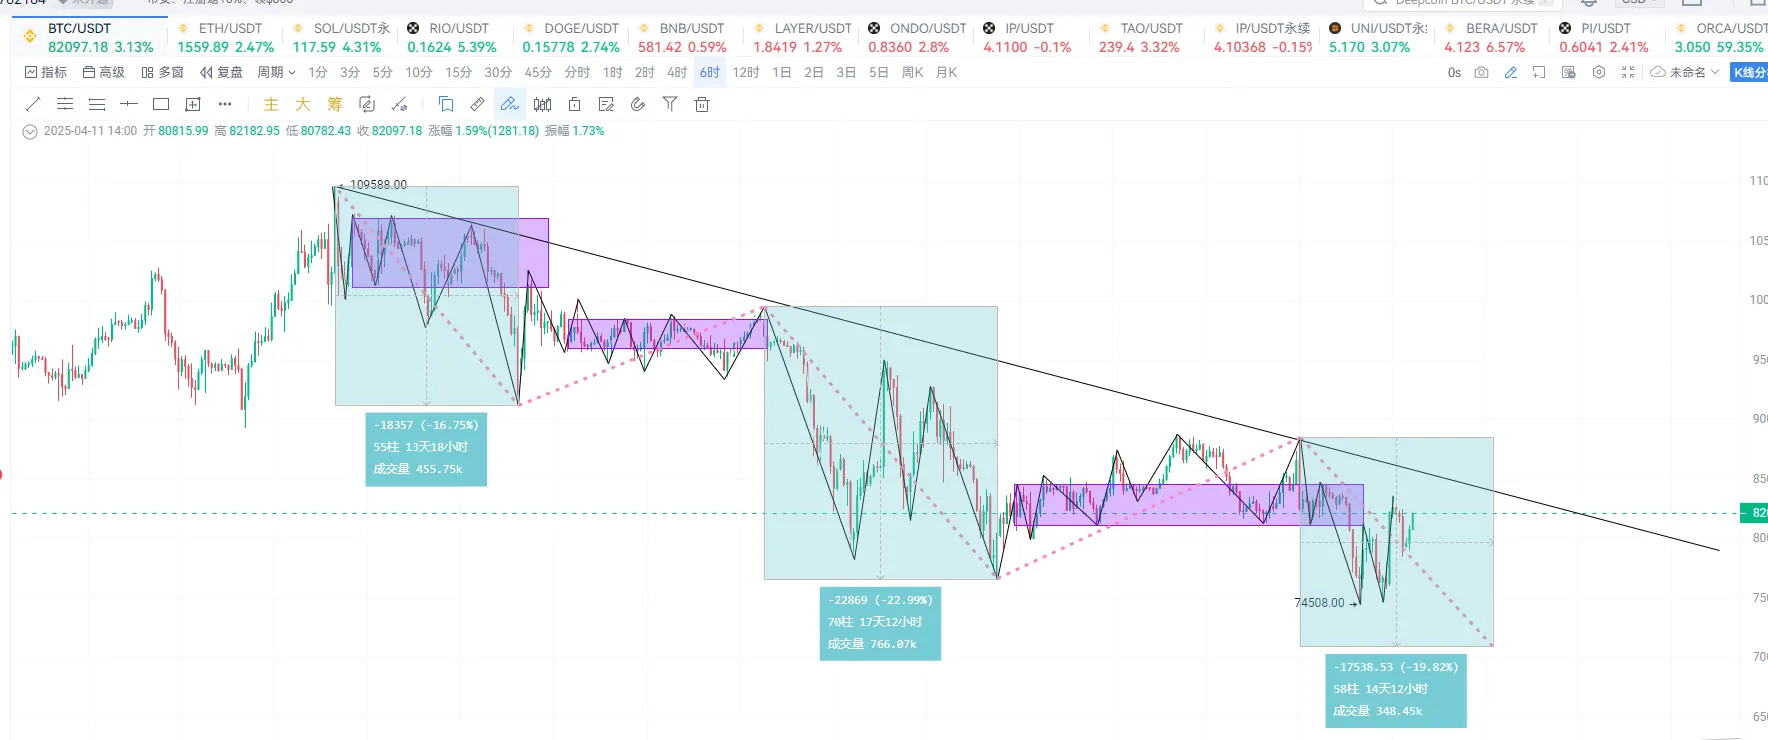
From the 6-hour level, the market trend is in the last stroke of decline. Judging from the time of the previous two declines, this decline lasted for 4/3 days, and the decline has lasted for 8 days so far. Although there is a possibility that the decline is in the divergence section, the decline time is not enough.
Maintaining this view, the future trend of BTC may be as shown in the figure. At this stage, it has rebounded back to the lower track range of the central axis at 8.1w, and the upper track pressure is at 8.45w. If it breaks through the upper track but the entity part does not exceed the starting point of the decline at 8.87w (understood as a false breakthrough of the downward trend line and does not break through the previous high), it will still fluctuate downward and fall below 7.45w.
Analysis 2: 74508 is low
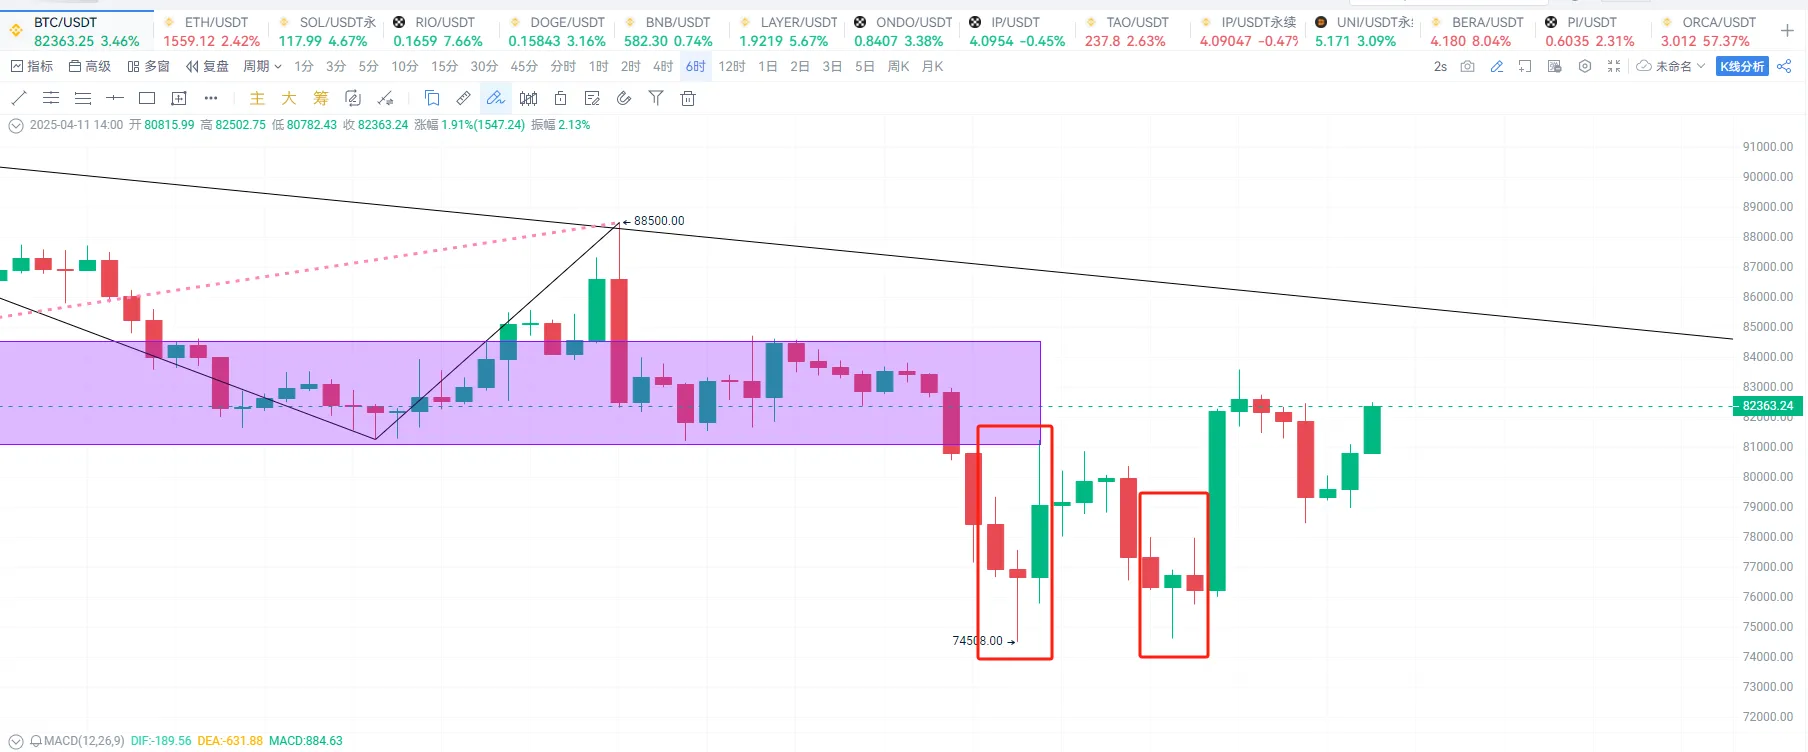
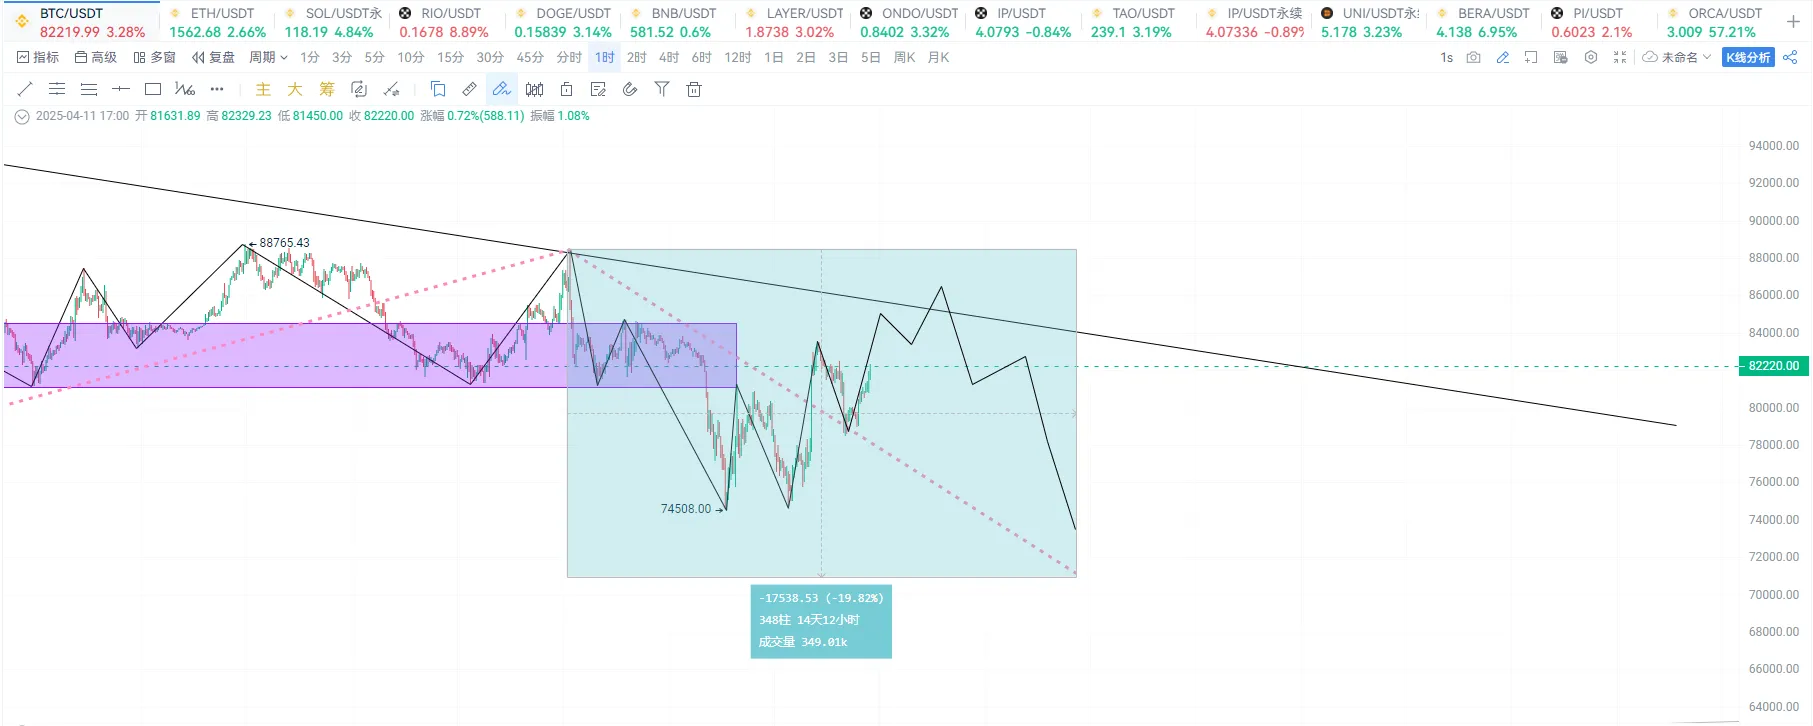
Due to the huge stimulus from the tariff news, the market panic accelerated the decline of the last transaction. Structurally, it meets the requirements to become a bottom pattern. The downward momentum is attenuating, and the bottom w is a double bottom, and both are strong bottom pattern structures.
Maintaining this view, the possible trend in the later period is to directly break through 8.85w to break the previous pattern of lower and lower highs and lower and lower lows of the red dotted line, and to carry out a wave of rise at the same level in 6 hours.
Comprehensive analysis:
Trump's speeches since taking office have said that he would legalize BTC in various states, but it has not been passed yet, and the proposal to purchase BTC as a reserve asset has been changed to not selling confiscated assets, including recent tariffs. The entire market has been severely affected and the uncertainty is too high. Although the market expects interest rates to be cut by 100BP four times this year due to the tariff war, the tariffs are currently suspended for 90 days, but the risks have not been released yet. The market still has enough time to consolidate, and in the process of a sharp rebound, ETFs are still in a state of large outflows, and off-market funds are still weak. On the whole, before there is no important news stimulus, the market may fluctuate downward between 76,000-85,000 in the short term and finally break below 74,500, and the downward space is limited.
Special thanks
Creation is not easy. If you need to reprint or quote, please contact the author in advance for authorization or indicate the source. Thank you again for your support.
Written by: Sylvia / Jim / Mat / Cage / WolfDAO
Edited by: Punko / Nora
Thanks to the above partners for their outstanding contributions to this weekly report. This weekly report is published by WolfDAO for learning, communication, research or appreciation only.