
By Marie Poteriaieva
Source: Cointelegraph
Compiled by: Shan Ouba, Golden Finance
Key Takeaways
- Web3 daily active users: Remain at 24 million in the second quarter of 2025, but the composition of each track is changing.
- DeFi: ranks first with 240 million transactions per week, but Ethereum gas consumption is now mainly occupied by RWA, DePIN and AI.
- Outperforming assets: Smart contract platform tokens, yield-generating DeFi and RWA tokens outperformed the market; AI and DePIN lagged despite strong narratives.
Altcoins are more than just speculative assets in lieu of Bitcoin. In most cases, they represent, or attempt to represent, specific areas of activity within the Web3 ecosystem, which is seen as a decentralized alternative to the traditional internet and its services.
To assess the current state and potential of the altcoin market, look beyond price alone. Metrics such as gas consumption, transaction volume, and unique active wallets (UAWs) can gauge activity and adoption, while token price performance reveals whether the market is following on-chain trends.
AI and social DApps are gaining widespread adoption
UAW (Unique Active Wallets) counts the number of unique addresses interacting with DApps, which can measure the breadth of user adoption to a certain extent (but may be overestimated due to multiple wallets or automated operations).
DappRadar's Q2 2025 report shows that daily wallet activity has stabilized at approximately 24 million. However, sector dominance is shifting. Crypto games remain the largest category, holding over 20% of the market, but this has declined compared to Q1. DeFi has also declined, from over 26% to less than 19%.
In contrast, social and AI-related DApps are gaining momentum. Farcaster leads the social space, with approximately 40,000 daily active users (UAWs). In the AI sector, agent-based protocols like Virtuals Protocol (VIRTUAL $1.18) are performing well, attracting approximately 1,900 UAWs weekly.
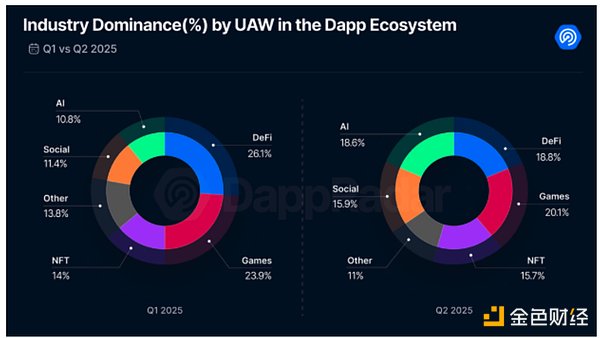
UAW dominates the DApp industry. Source: DappRadar
DeFi attracts “big players”
The number of transactions shows how often smart contracts are triggered, but are vulnerable to bots and automation.
DeFi's transaction footprint is somewhat contradictory. Despite a decline in its user base, it still generates over 240 million transactions per week—more than any other Web3 category. Exchange-related activity (which may overlap with DeFi) further solidifies DeFi's dominance, while crypto games account for 100 million weekly transactions and the "Other" category (which excludes social but includes AI) accounts for 57 million transactions.
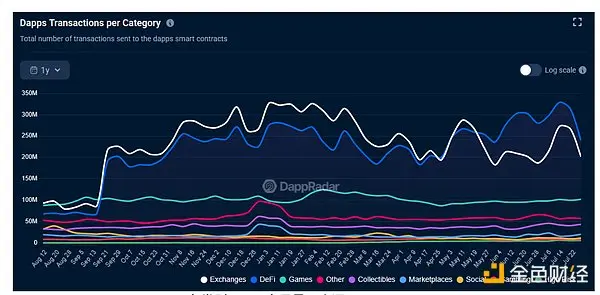
DApp transaction volume by category. Source: DappRadar
The total value locked (TVL) is even more powerful. According to DefiLlama, DeFi TVL has reached $137 billion, a 150% increase since January 2024, but still below the peak of $177 billion at the end of 2021.
The divergence between rising TVL and declining UAW reflects a key theme of this cryptocurrency cycle: institutionalization. Capital is concentrating in fewer, larger wallets, and now also funds. This trend remains nascent due to regulatory uncertainty surrounding DeFi in many jurisdictions.
Still, institutions are testing the waters by providing liquidity to permissioned pools, lending through tokenized treasuries on platforms like Ondo Finance and Maple (SYROP), the latter also known for its partnership with investment bank Cantor Fitzgerald.
Meanwhile, as DeFi evolves into a capital-efficient layer geared towards large-scale yield generation rather than retail participation, protocol-level automation offered by DeFi services like Lido (LIDO) or EigenLayer further dampens wallet activity.
Other use cases are dominating Ethereum’s gas consumption
Transaction data alone cannot fully present the full picture of Web3, but Ethereum's gas usage can reveal the true distribution of economic and computing loads.
Data from Glassnode shows that although DeFi has always been a core sector of Ethereum, its gas consumption now accounts for only 11%; NFT once occupied a considerable share in 2022, but now it has dropped to 4%.
In contrast, the “Other” category has soared from approximately 25% in 2022 to over 58% today. This category encompasses services such as tokenized real-world assets (RWAs), decentralized physical infrastructure (DePINs), AI-driven DApps, and other more or less novel services that have the potential to define the next phase of Web3 growth.
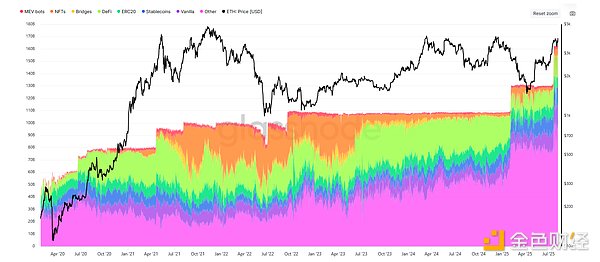
Ethereum gas usage by category. Source: Glassnode
In particular, RWA is often regarded as one of the most promising crypto areas. Excluding stablecoins, its total size has jumped from $15.8 billion at the beginning of 2024 to $25.4 billion today, involving approximately 346,000 token holders.
Will prices follow the Web3 narrative?
Asset prices rarely keep pace with on-chain activity. Hype can drive price spikes in the short term, but sustained growth tends to align with sectors demonstrating real utility and adoption. Over the past year, infrastructure and yield-oriented projects have significantly outperformed sectors driven solely by narrative.
Smart contract platform tokens saw the strongest gains, with the top ten coin offerings averaging a 142% increase. HBAR saw a 360% surge, while XLM saw a 334% increase. As the foundational building blocks of Web3, the price growth of these tokens demonstrates investor confidence in the long-term development of the sector. DeFi tokens also performed well, averaging a 77% year-over-year increase, with Curve DAO (CRV) up 308% and Pendle (PENDLE) up 110%.
The top ten RWA tokens saw an average gain of 65%, primarily driven by XDC (+237%) and OUSG (+137%). DePIN sector highlights JasmyCoin (+72%) and Aethir (+39%) still saw average gains hovering around 10%.
AI tokens lagged significantly behind: the top ten pure AI projects saw a 25% year-over-year decline, with Bittensor (TAO) alone posting a 34% gain. Gaming tokens mostly declined, with SuperVerse (SUPER) alone experiencing a 750% surge over the past 12 months. Social tokens remain virtually absent from the crypto landscape, with major protocols still lacking native assets.
Overall, Web3 investment remains concentrated in mature sectors, driving up the native currencies of major smart contract platforms. Yield-oriented DeFi and RWA tokens have also delivered impressive returns. In contrast, the most hyped narratives—AI, Decentralized PINs, and social—have yet to translate this buzz into tangible token returns.
As adoption grows and more sectors mature, the gap between narrative and performance may narrow, but for now, investor confidence remains firmly rooted in the foundation of the decentralized economy.
