By Sam Callahan and Lyn Alden
Compiled by: Vernacular Blockchain
The liquidity of the crypto market has been in crisis recently. After months of sideways fluctuations, Bitcoin has fallen again, reaching a low of $86,000, a correction of nearly 20% from its high point. As the leading cryptocurrency, the decline of Bitcoin has brought about the collapse of a number of altcoins, and market sentiment has also turned from greed in the MeMe period to panic.
Is the cryptocurrency bull market still here? Will Bitcoin break through again? This is a topic that many people are concerned about. However, the current trend of Bitcoin is closely related to the global financial market. Sam Callahan, a research analyst at Swan Bitcoin, wrote an article about the relationship between Bitcoin prices and global liquidity that is worth reading.
The following is the text:
Bitcoin moves in line with global liquidity 83% of the time in any 12-month period, a higher proportion than any other major asset class, making it a strong indicator of liquidity conditions.
Despite the high correlation between Bitcoin and global liquidity, it is not completely immune to short-term deviations, especially during periods of extreme valuations, disruptions by specific events or internal market dynamics.
Combining global liquidity conditions and Bitcoin on-chain valuation indicators can provide a more nuanced understanding of Bitcoin's cyclical changes and help investors identify moments when market internal dynamics may temporarily deviate from Bitcoin's liquidity trend.
Understanding how asset prices fluctuate with changes in global liquidity has become the key for investors to improve returns and effectively manage risks. In today's market, asset prices are increasingly directly affected by central bank policies, and liquidity conditions have become the main factor driving asset prices, while fundamentals alone no longer play a decisive role.
This has been particularly evident since the global financial crisis (2007-2008). Since then, increasingly unconventional monetary policies have become the dominant force driving asset prices. By manipulating liquidity levers, central banks have turned the market into a big deal, and as economist Mohamed El-Erian puts it, central banks have become "the only protagonists."
Stanley Druckenmiller agreed, noting that “yields don’t drive the overall market; it’s the Fed…watch the central bank, watch what’s happening with liquidity…most people in the market are looking for yields and traditional indicators, but it’s liquidity that drives the market.”
This is particularly evident when examining the close correlation between the S&P 500 and global liquidity.
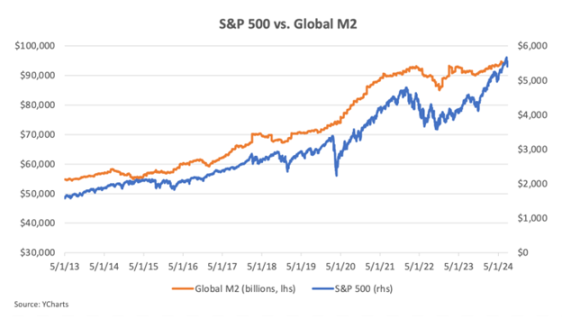
The explanation for the above chart comes down to simple supply and demand. If more money is available to buy assets, whether it's stocks, bonds, gold, or Bitcoin, the prices of those assets will generally rise. Since 2008, central banks have pumped a lot of fiat money into the system, and asset prices have risen. In other words, monetary inflation drives asset price inflation.
Against this backdrop, understanding how to measure global liquidity and how different assets react to changes in liquidity has become key for investors to navigate liquidity-driven markets.
How to measure global liquidity
There are many ways to measure global liquidity, but for this analysis we will use global M2 - a broad measure of money supply that covers physical currency, demand deposits, savings deposits, money market securities, and other forms of easily accessible cash.
Bitcoin Magazine Pro provides a measure of global M2 that aggregates data from eight major economies: the United States, China, the Eurozone, the United Kingdom, Japan, Canada, Russia, and Australia. This metric is a good proxy for global liquidity because it reflects the total amount of money available for spending, investment, and borrowing around the world. In other words, it can be viewed as a measure of the total amount of global credit creation and central bank money printing.
It is important to note that global M2 is denominated in US dollars. Lyn Alden explains the importance of this in an article:
The strength of the dollar is crucial because it is the world's reserve currency and the primary unit of account for global trade, contracts, and debts. When the dollar is strong, countries' debt burdens increase, and when the dollar is weak, debt burdens decrease. The global broad money supply, denominated in dollars, is a key measure of global liquidity. How fast are fiat currency units being created? How strong is the dollar in global currency markets?
When global M2 is denominated in US dollars, it reflects not only the relative strength of the US dollar, but also the pace of credit creation, making it a reliable indicator for assessing global liquidity conditions.
While there are other ways to measure global liquidity, such as considering short-term government debt or global foreign exchange swaps markets, in the following article, when referring to "global liquidity", we will refer to it as "global M2".
Why Bitcoin May Be the Purest Liquidity Barometer
Over the years, one of the assets that has shown a strong correlation with global liquidity is Bitcoin. As global liquidity expands, Bitcoin usually performs strongly; when liquidity shrinks, Bitcoin tends to perform poorly. This dynamic has led some people to call Bitcoin a "liquidity barometer."
The chart below clearly shows how Bitcoin price moves in line with changes in global liquidity.
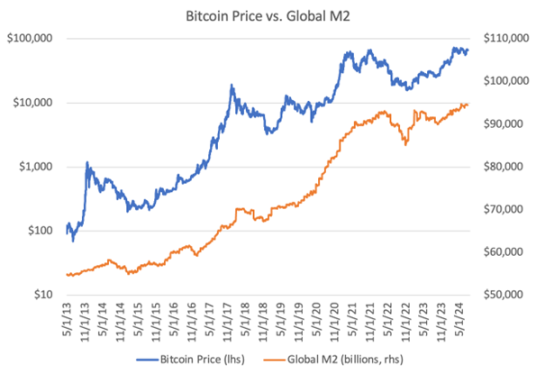
Likewise, comparing Bitcoin to the year-over-year change in global liquidity further highlights the close correlation between the two: when liquidity increases, Bitcoin prices rise; when liquidity decreases, Bitcoin prices fall.
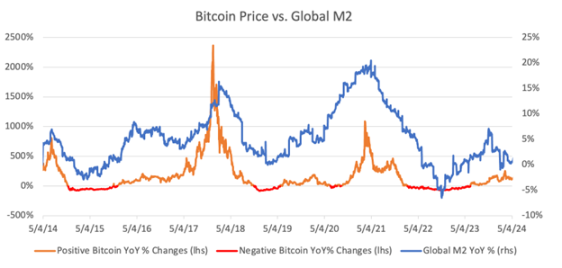
As can be seen from the above chart, Bitcoin’s price is very sensitive to changes in global liquidity. But is it really the most liquidity-sensitive asset in the market today?
In general, risky assets are more significantly correlated with liquidity conditions. In an environment of ample liquidity, investors tend to adopt higher risk/high return investment strategies and shift funds to assets that are considered riskier; conversely, when liquidity tightens, investors generally turn to assets they consider safer. This can explain why assets like stocks generally perform well when liquidity increases.
However, stock prices are also affected by other factors unrelated to liquidity. For example, the performance of stocks is driven in part by earnings and dividends, so their prices tend to be correlated with economic performance. This can weaken the pure correlation between stocks and global liquidity. In addition, U.S. stocks are affected by passive inflows into retirement accounts (such as 401(k)s), which affect their performance regardless of liquidity conditions. These passive inflows may provide a buffer for U.S. stocks during liquidity fluctuations, making them less sensitive to global liquidity conditions.
Gold's relationship with liquidity is more complex. On the one hand, gold benefits from increased liquidity and a weaker dollar; on the other hand, it is also seen as a safe-haven asset. When liquidity shrinks and markets turn to risk-averse behavior, investors seek safety, which may increase demand for gold. Therefore, even if liquidity is drained from the system, the price of gold may still perform well. This means that the performance of gold is not necessarily closely related to liquidity conditions. Similarly, bonds are also seen as safe-haven assets, so their correlation with liquidity conditions may be low.
Back to Bitcoin, unlike stocks, Bitcoin has no income or dividends, and there is no structural buying that affects its performance. Compared with gold and bonds, most capital pools still view Bitcoin as a risky asset during its adoption cycle. This may keep Bitcoin relatively pure in terms of global liquidity.
If this holds true, it is a valuable insight for Bitcoin investors and traders. For long-term holders, understanding Bitcoin's correlation with liquidity can provide deeper insights into the driving forces behind price movements. For traders, Bitcoin is an effective tool to express views on the future direction of global liquidity.
This article aims to delve deeper into Bitcoin’s correlation with global liquidity, compare its relationship with other asset classes, identify periods of disruption in correlation, and share insights on how investors can use this information to gain an edge in the future.
Quantifying Bitcoin’s correlation with global liquidity
When analyzing the correlation between Bitcoin and global liquidity, it is important to consider both the strength and direction of the correlation. The strength of the correlation reveals the degree of synchronization between the two variables. A stronger correlation means that changes in global M2 have a more predictable impact on Bitcoin prices, whether in the same direction or in the opposite direction. Understanding this strength is key to assessing Bitcoin's sensitivity to fluctuations in global liquidity.
By analyzing the data from May 2013 to July 2024, we can clearly see the strong sensitivity of Bitcoin to liquidity. During this period, the correlation between Bitcoin price and global liquidity reached 0.94, showing an extremely strong positive correlation. This shows that during this time period, Bitcoin price was highly sensitive to changes in global liquidity.
However, if we look at the 12-month rolling correlation, the average correlation between Bitcoin and global liquidity drops to 0.51. This is still a moderately positive correlation, but significantly lower than the overall correlation.
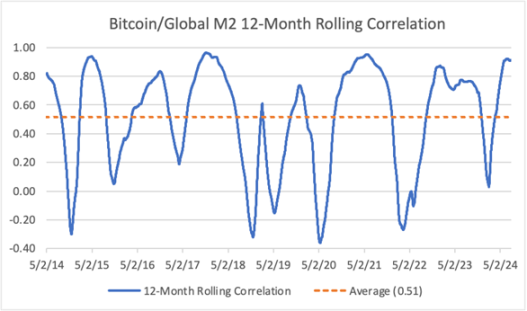
This suggests that Bitcoin’s price has not remained so closely tied to liquidity on a year-over-year basis. Furthermore, when looking at the 6-month rolling correlation, the correlation drops further to 0.36. This means that as the time frame shortens, Bitcoin’s price deviates more from its long-term liquidity trend, suggesting that short-term price fluctuations are more likely to be affected by factors specific to Bitcoin itself rather than liquidity conditions.
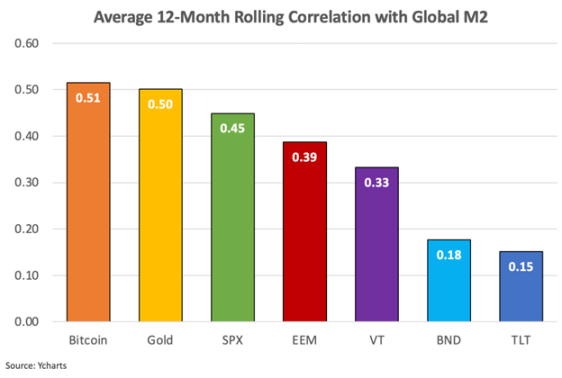
To better understand Bitcoin’s correlation with global liquidity, we compared it to other assets, including the SPDR S&P 500 ETF (SPX), Vanguard Total Global Equity Index ETF (VT), iShares MSCI Emerging Markets ETF (EEM), iShares 20+ Year U.S. Treasury Bond ETF (TLT), Vanguard Total Bond Market ETF (BND), and gold.
On a rolling 12-month timeframe, Bitcoin has the highest average correlation with global liquidity, followed by gold. Equity indices have slightly weaker correlations, while bond indices have the lowest correlation with liquidity, as expected.
When analyzing the correlation of assets to global liquidity by year-over-year change, stock indices have a slightly stronger correlation than Bitcoin, followed by gold and bonds.
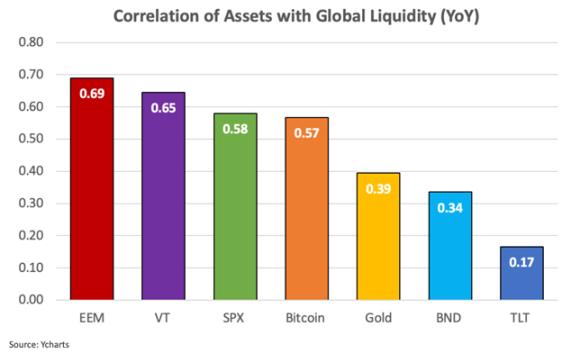
One reason why stocks may be more closely correlated with global liquidity than Bitcoin in year-over-year changes is Bitcoin’s high volatility. Bitcoin often experiences large price swings within a year, which may distort its correlation with global liquidity. In contrast, stock indexes typically exhibit smaller price swings, making them more consistent with year-over-year changes in global M2. Nonetheless, Bitcoin still shows a moderately strong correlation with global liquidity in the year-over-year analysis.
The above data highlights three key takeaways:
1) The performance of stocks, gold and Bitcoin is closely related to global liquidity;
2) Bitcoin has a strong overall correlation with other asset classes and has the highest correlation over a rolling 12-month period;
3) Bitcoin’s correlation with global liquidity weakens when the time frame shortens.
Bitcoin’s directional consistency with liquidity makes it unique. As mentioned earlier, a strong positive correlation does not guarantee that the two variables will always move in the same direction, which is particularly evident in volatile assets such as Bitcoin, which may temporarily deviate from the long-term relationship with relatively stable indicators such as global M2. Therefore, combining these two aspects, strength and direction, can provide a more comprehensive understanding of the interaction between Bitcoin and global M2.
By examining the directional consistency of this relationship, we can better understand the reliability of its correlation, which is particularly important for investors who focus on long-term trends. If you know that Bitcoin tends to follow the direction of global liquidity changes most of the time, you can have more confidence in predicting its future price movements based on changes in liquidity conditions.
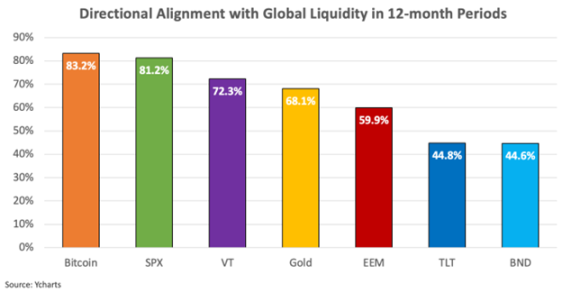
In terms of stability of directional consistency, Bitcoin has the highest directional consistency with global liquidity among all analyzed assets. The probability of Bitcoin moving in the same direction as global liquidity is 83% over a 12-month period and 74% over a 6-month period, highlighting the consistency of the directional relationship.
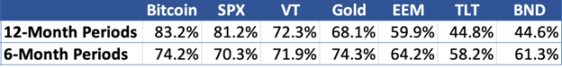
The chart below further demonstrates Bitcoin’s directional alignment with global liquidity over a 12-month period, compared to other asset classes.
These findings are important because they show that, while the strength of the correlation may vary by time frame, Bitcoin’s price direction is generally aligned with the direction of global liquidity. Furthermore, Bitcoin’s price direction is closer to global liquidity than any other traditional asset.
This analysis shows that the relationship between Bitcoin and global liquidity is not only significant in strength, but also very stable in direction consistency. The data shows that Bitcoin is more sensitive to liquidity conditions than other traditional assets, especially over longer time frames.
For investors, this means that global liquidity may be a key driver of Bitcoin's long-term price performance, and should be taken seriously when evaluating Bitcoin market cycles and predicting future price fluctuations. For traders, this means that Bitcoin has become a highly sensitive investment tool that expresses views on global liquidity, suitable for investors who have strong beliefs in liquidity.
Identifying breaks in Bitcoin’s long-term liquidity relationship
Despite Bitcoin’s strong overall correlation with global liquidity, the study found that Bitcoin’s price tends to deviate from liquidity trends over shorter rolling periods. These deviations may be due to internal market dynamics exerting a greater influence at certain points in the Bitcoin market cycle, or may be triggered by events specific to the Bitcoin industry.
These individual events are events that occur within the broader crypto industry and often lead to rapid changes in market sentiment or trigger large-scale liquidations. For example, major bankruptcies, exchange hacks, regulatory developments, or the collapse of Ponzi schemes are all typical examples of such events.
Looking at historical instances of weakening 12-month rolling correlations between Bitcoin and global liquidity, it is clear that Bitcoin’s price tends to decouple from liquidity trends when major industry events occur. The chart below shows the breakdown of Bitcoin’s correlation with liquidity when these major events occur.
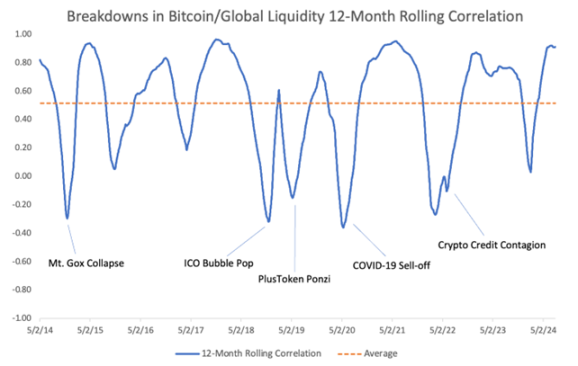
Key events such as the collapse of Mt. Gox, the unravelling of the PlusToken Ponzi scheme, and the crypto credit collapse triggered by the Terra/Luna collapse and the bankruptcy of multiple crypto lenders have all led to panic and selling pressure that were largely unrelated to global liquidity trends.
The 2020 COVID-19 market crash provides another example. Bitcoin initially experienced a sharp decline amid widespread panic selling and risk aversion. However, as central banks responded with unprecedented liquidity injections, Bitcoin quickly rebounded, highlighting its sensitivity to liquidity changes. The correlation break at the time was primarily due to a sudden shift in market sentiment rather than changes in liquidity conditions.
While it is important to understand the impact of these individual events on Bitcoin’s correlation with global liquidity, their unpredictability makes them less actionable for investors. However, as the Bitcoin ecosystem matures, infrastructure improves, and regulatory clarity increases, I expect the frequency of these “black swan” events to decrease over time.
How supply-side dynamics affect Bitcoin’s liquidity relevance
Aside from isolated events, another notable pattern in Bitcoin’s weakening correlation with liquidity is that it often coincides with periods when Bitcoin prices reached extreme valuations and subsequently fell sharply. This was particularly evident during the peaks of the bull markets in 2013, 2017, and 2021, where Bitcoin’s liquidity correlation was disconnected as prices fell significantly from their highs.
While liquidity primarily affects demand, understanding the distribution patterns on the supply side can also help identify periods when Bitcoin may deviate from its long-term correlation with global liquidity. The main source of supply available for sale is profit-taking by old holders as Bitcoin prices rise. In addition, there is new issuance from block rewards, but this portion is relatively small and continues to decrease with each halving event. During a bull market, old holders tend to reduce their holdings and sell them to new buyers until new demand reaches saturation. At this saturation point, the peak of the bull market usually occurs.
The key indicator to assess this behavior is the Bitcoin HODL Wave for one year and above, which measures the percentage of Bitcoin held by long-term investors who have held for at least one year as a percentage of the total circulating supply. In simple terms, it reflects the proportion of the available supply held by long-term investors at any given moment.
Historically, the indicator tends to fall during bull markets as long-term holders choose to sell, and rise during bear markets as they accumulate. The chart below highlights this behavior, with red circles marking cycle peaks and green circles indicating bottoms.
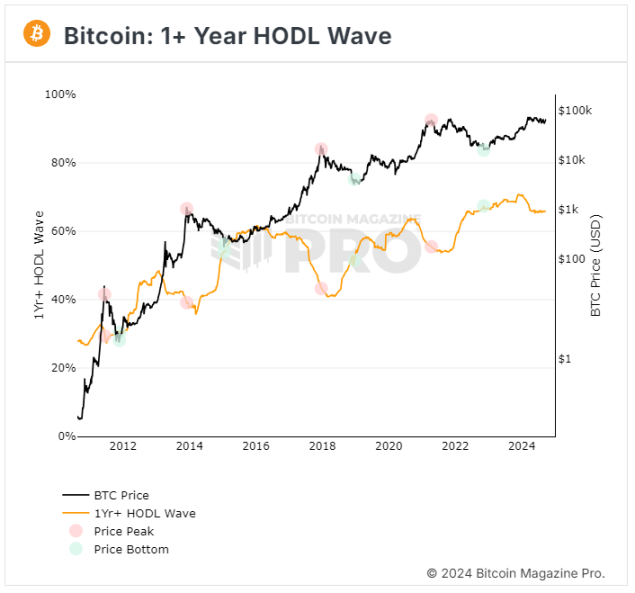
This illustrates the behavior of long-term holders during Bitcoin cycles. Long-term holders tend to take profits when Bitcoin is considered overvalued, and tend to accumulate when Bitcoin is considered undervalued.
The question becomes… “How can one tell if Bitcoin is undervalued or overvalued so as to better predict when supply will flood in or out of the market?”
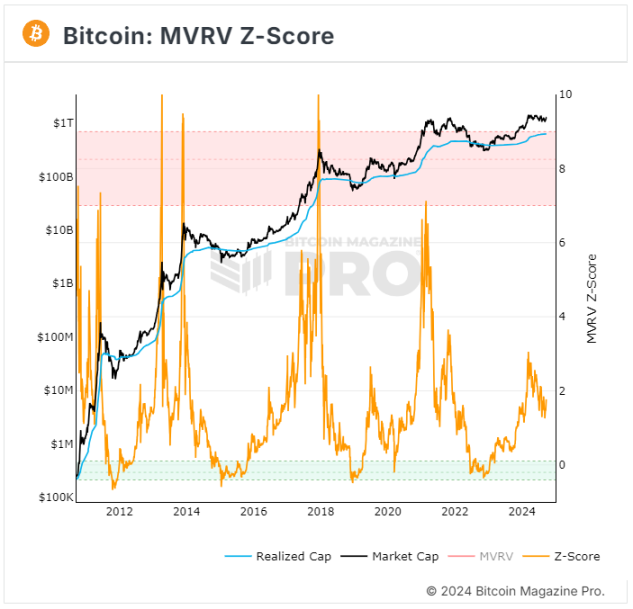
Although the data set is still relatively small, the Market Value to Realized Value Z-score (MVRV Z-score) has proven to be an effective tool for identifying whether Bitcoin has reached extreme valuation levels. The MVRV Z-score is composed of the following three components:
1) Market Value – Current market value, calculated by multiplying the price of Bitcoin by the total number of coins in circulation.
2) Realized Value — The average price at which each Bitcoin or Unspent Transaction Output (UTXO) last traded on-chain, multiplied by the total circulating supply, is essentially the on-chain cost basis for Bitcoin holders.
3) Z-score – This score measures the degree of deviation between market value and realized value, expressed as a standard deviation, and highlights periods of extreme overvaluation or undervaluation.
When the MVRV Z-score is high, it means that there is a large gap between the market price and the realized price, and many holders are enjoying unrealized profits. While this is intuitively a good sign, it can also be a sign that Bitcoin is overvalued or overbought - meaning that long-term holders may start distributing their Bitcoin and taking profits.
Conversely, when the MVRV Z-score is low, the market price is close to or below the realized price, which indicates that Bitcoin is undervalued or oversold — a good opportunity for investors to start accumulating.
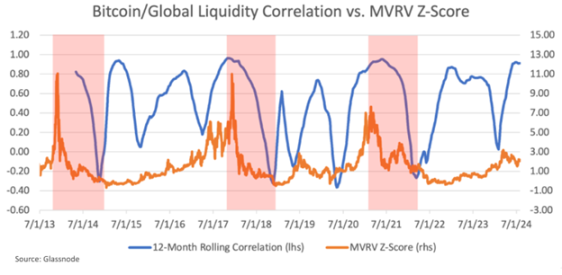
When overlaying the MVRV Z-score with the 12-month rolling correlation between Bitcoin and global liquidity, a clear pattern can begin to be discerned. When the MVRV Z-score drops sharply from its all-time highs, the 12-month rolling correlation appears to follow suit. The red rectangle below highlights these periods.
This phenomenon suggests that when Bitcoin prices reach extremely high valuations and begin to adjust, their correlation with global liquidity may weaken. This weakened correlation reflects the impact of supply-side dynamics and the dominant role of market sentiment on price behavior. During these periods, long-term holders often choose to sell at a profit, while short-term traders may overreact to price fluctuations, resulting in a disconnect between the short-term movement of Bitcoin prices and changes in global liquidity conditions.
This analysis provides investors with important insights to help them identify potential shifts in the relationship between Bitcoin and liquidity, as well as possible market corrections at elevated valuation levels.
This suggests that when Bitcoin's MVRV Z-score declines from high levels and its correlation with liquidity weakens, internal market dynamics (such as profit-taking and panic selling) may have a greater impact on Bitcoin prices than global liquidity conditions. At extreme valuation levels, Bitcoin's price movements tend to be driven more by market sentiment and supply-side dynamics than global liquidity trends.
This insight is important for traders and investors because it helps identify those rare moments when Bitcoin deviates from its long-term liquidity correlation. For example, let's say a trader strongly believes that the dollar will depreciate and global liquidity will rise over the next year. According to this analysis, Bitcoin would be the best tool to express this view because it acts as the purest liquidity barometer in the market.
However, these findings suggest that traders should first assess Bitcoin’s MVRV Z-score or other similar valuation metrics before placing orders. If Bitcoin’s MVRV Z-score shows extreme overvaluation, traders should remain cautious despite a positive liquidity environment, as internal market dynamics could overwhelm liquidity conditions and trigger a price correction.
By simultaneously monitoring Bitcoin's long-term correlation with global liquidity and its MVRV Z-score, investors and traders are able to better predict how Bitcoin's price will respond to changes in liquidity conditions. This approach enables market participants to make more informed decisions and potentially improve their chances of success when investing or trading Bitcoin.
in conclusion
The strong correlation between Bitcoin and global liquidity makes it an important macroeconomic barometer for investors and traders. Not only is this correlation strong, it also shows a high degree of directional consistency when compared to other asset classes. Bitcoin can be thought of as a mirror that reflects the rate of global money creation and the relative strength of the U.S. dollar. And unlike traditional assets such as stocks, gold or bonds, Bitcoin's correlation with liquidity remains relatively pure.
However, Bitcoin’s correlation is not perfect. The study found that Bitcoin’s correlation strength decreases over shorter time frames, which emphasizes the importance of identifying moments when the correlation between Bitcoin and liquidity may break. Internal market dynamics, such as idiosyncratic shocks or extreme valuation levels, can cause Bitcoin to temporarily deviate from global liquidity conditions. These moments are critical for investors as they often mark price corrections or accumulation phases.
Combining global liquidity analysis with on-chain metrics such as the MVRV Z-score can help better understand Bitcoin’s price cycles and help identify moments when prices are more likely to be driven by market sentiment rather than broad liquidity trends.
Michael Saylor once said, “All your models are destroyed.” Bitcoin represents a paradigm shift in money itself. Therefore, no statistical model can perfectly capture the complexity of the Bitcoin phenomenon, but some models can serve as useful tools for decision guidance, even though they are not perfect. As the old saying goes, “Nothing is absolute in the world, but some models are still useful.”
Since the global financial crisis (2007-2008), central banks have distorted financial markets through unconventional policies, making liquidity the main driver of asset prices. Therefore, understanding the changes in global liquidity is crucial for any investor who hopes to succeed in today's market. In the past, macro analyst Luke Gromen described Bitcoin as "the last working smoke alarm" because of its ability to signal changes in liquidity conditions, an analysis that has also been supported.
When the alarm bells sound for Bitcoin, investors should listen carefully in order to effectively manage risk and position themselves appropriately to seize future market opportunities.