A. Macro liquidity
Monetary liquidity has improved. A global sell-off in government bonds is underway, with the 30-year US Treasury yield surging back towards 5%. Behind the market turmoil lies a massive supply of corporate bonds and deep concerns about the fiscal health of governments worldwide. The surge in bond yields has directly depressed stock valuations, particularly high-valuation large-cap tech stocks that are highly sensitive to interest rates, triggering a broad decline in US stocks. Gold prices have reached new highs, while the crypto market has weakened alongside US stocks.
B. Overall market conditions
Top 300 companies by market capitalization:
Last week, BTC saw volatility, while altcoins generally fell. The premium on US treasury companies gradually disappeared. Market focus centered around the Trump family's new coin.
Top 5 gainers | Increase | Top 5 decliners | decline |
M | 80% | ZORA | 20% |
PYTH | 40% | ULTIMA | 20% |
PUMP | 30% | MORPHO | 20% |
EVA | 30% | BIO | 10% |
IP | 30% | MOG | 10% |
- WLFI: A Trump family project with a total market capitalization of $23 billion. A major investor's stake was unexpectedly unlocked, and the project owner proposed a buyback with transaction fees.
- SOL: The public chain needs to upgrade consensus and establish a US stock treasury company.
- BGB: It was originally the Bitget platform coin. 200 million of the 1.1 billion were destroyed and turned into the Morph public chain coin.
C. On-chain data
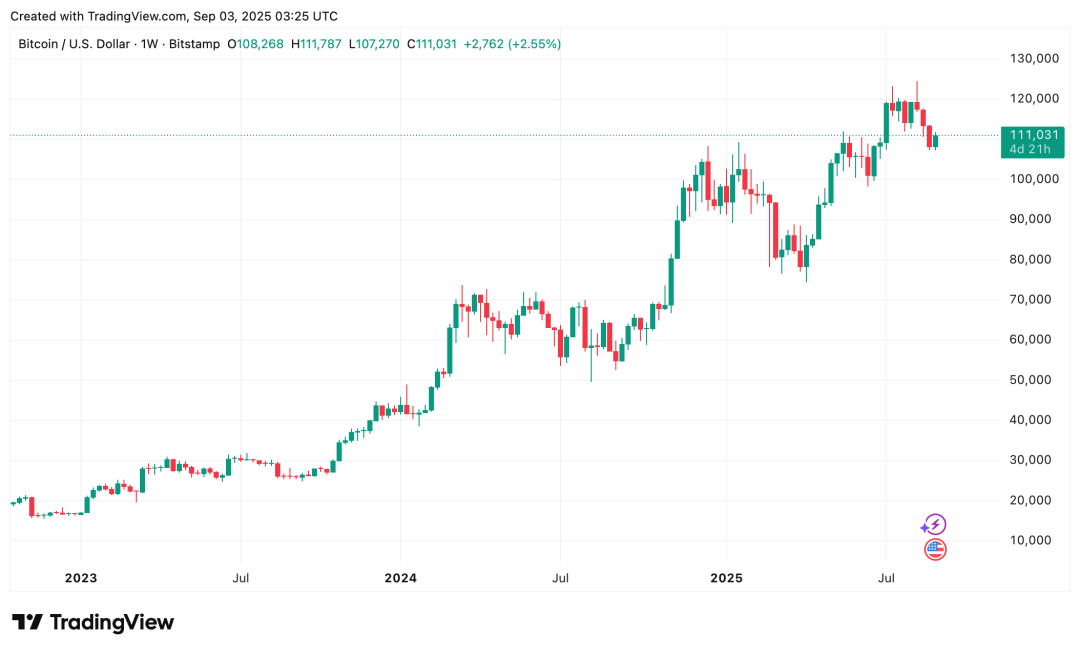
With the BTC price retreating from its all-time high to $110,000, the market is currently trading above the cost basis for short-term holders. Inflows into US spot ETFs are showing mixed signals. Net inflows have reversed to positive, but trading volume has shrunk. Regarding on-chain demand, active addresses and fees remain sluggish, indicating weak activity.

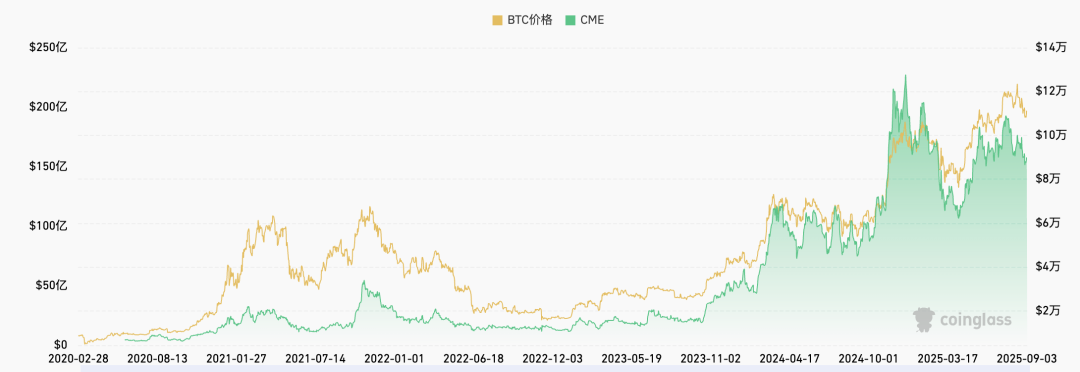
Institutional funds flowed in $4.4 billion in August, with ETH inflows exceeding BTC.
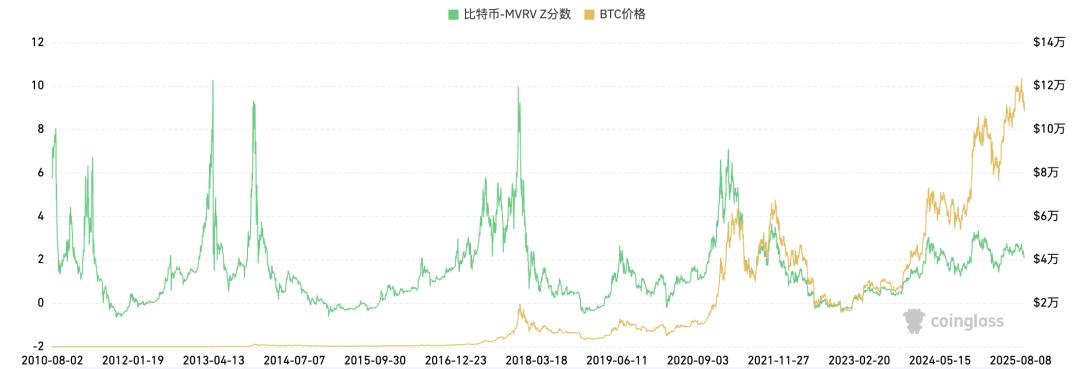
The long-term trend indicator, MVRV-ZScore, uses the market's total cost of ownership as a proxy for overall profitability. A reading above 6 indicates a top range, while a reading below 2 indicates a bottom range. When MVRV falls below the critical level of 1, holders are generally in a loss-making position. The current reading is 2.5, nearing the mid-range range.
D. Futures market
Futures Funding Rate: This week's rate of 0.00% is on the short-term bottom. Rates between 0.05-0.1% indicate higher leverage in long positions, signaling a short-term top. Rates between -0.1-0% indicate higher leverage in short positions, signaling a short-term bottom.
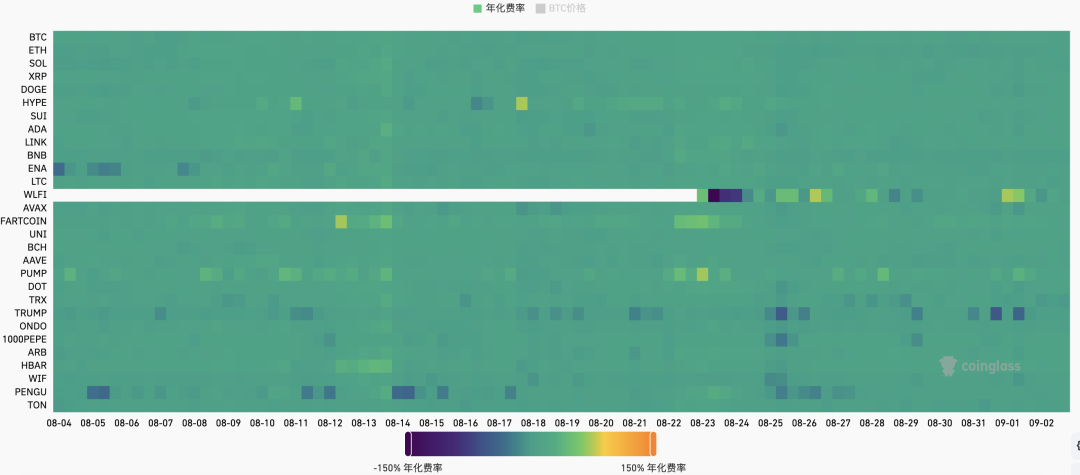
Futures Open Interest: BTC open interest decreased this week as major market funds withdrew.
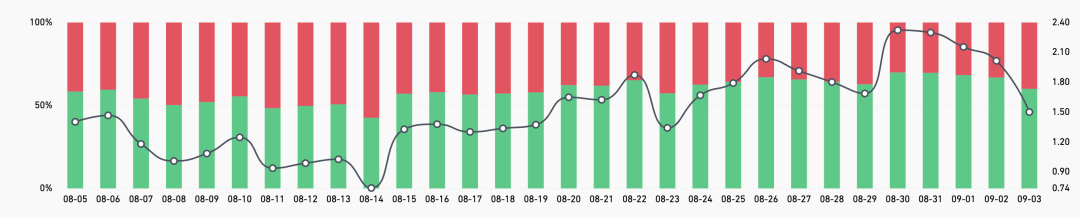
Futures long-short ratio: 1.6, indicating neutral market sentiment. Retail investor sentiment is often a contrarian indicator, with readings below 0.7 indicating fear and above 2.0 indicating greed. The long-short ratio fluctuates widely, making it less useful as a reference.
E. Spot Market
BTC rebounded slightly this week. MicroStrategy's preferred stock offering fell far short of expectations, and the company reneged on its promise to restart its common stock offering, significantly undermining market confidence. Historically, September is a bearish month for BTC prices.
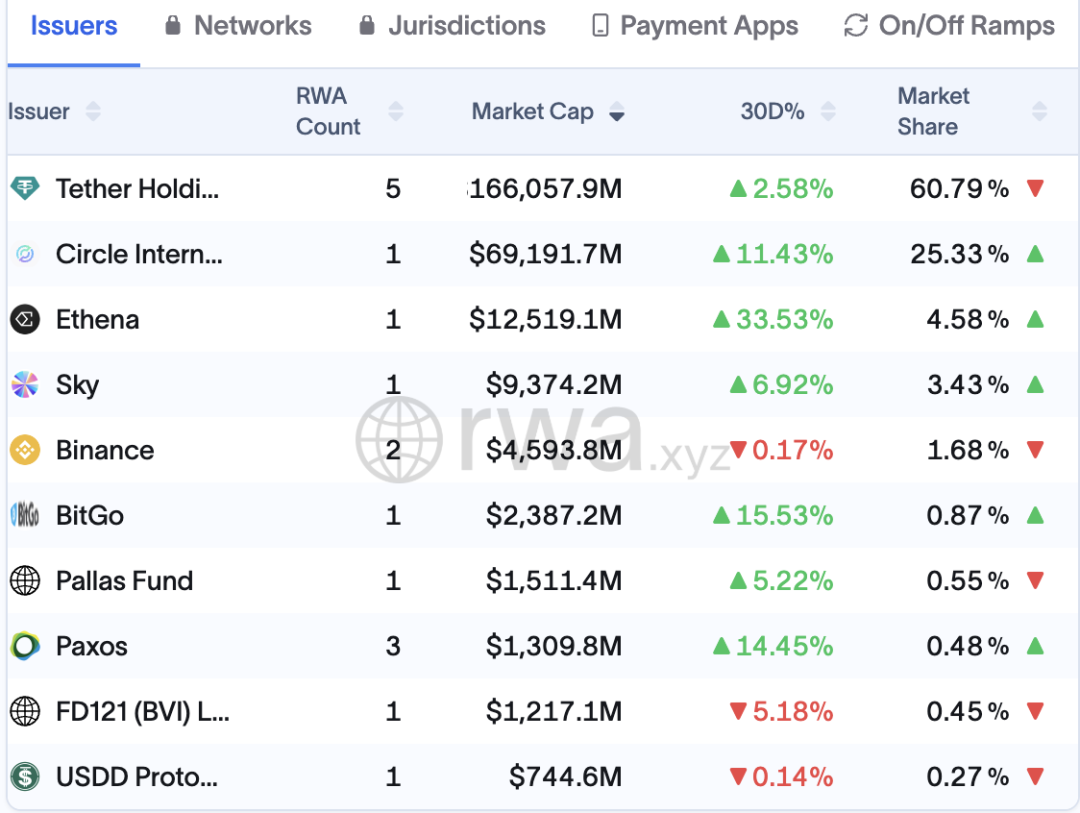
F. Stablecoin Market Global Mainstream Stablecoin Market Value
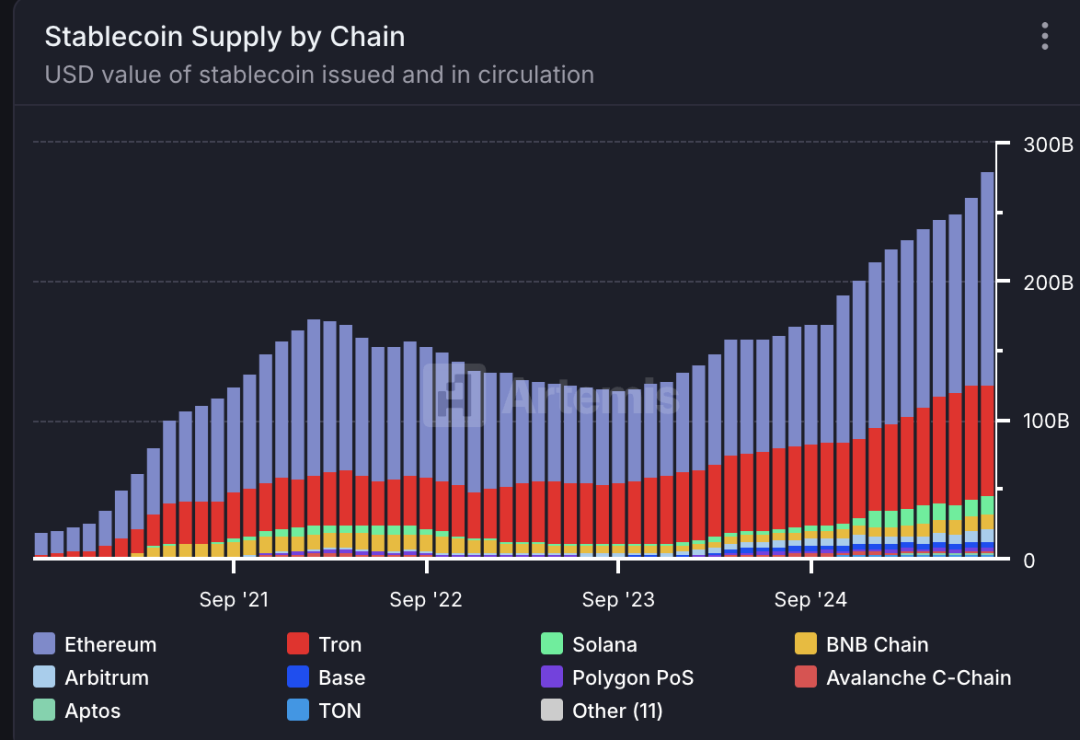
The total global stablecoin supply is $283.7B, up 1.4% week-over-week. USDT accounts for 61% of the market, while USDC accounts for 25%.
Ethena's synthetic stablecoin, USDe, has seen rapid growth, reaching $12.5 billion, primarily through high-interest revolving loans. USDe's narrative is that of an internet bond, and its appeal relies heavily on a positive funding rate environment. Bull markets are fertile ground for its growth.
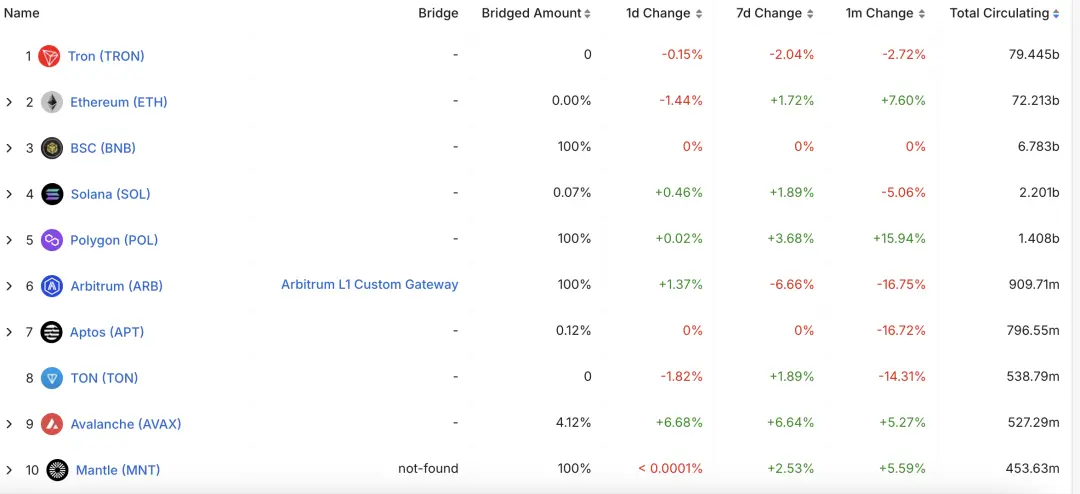
Stablecoins of various public chains
In the past 30 days, USDT on the Polygon chain has seen a significant increase of 16%, mainly due to the on-chain prediction of market demand.
USDT's stablecoin public chain Plasma plans to issue coins in the near future and launch multiple deposit and financial management activities on the exchange.
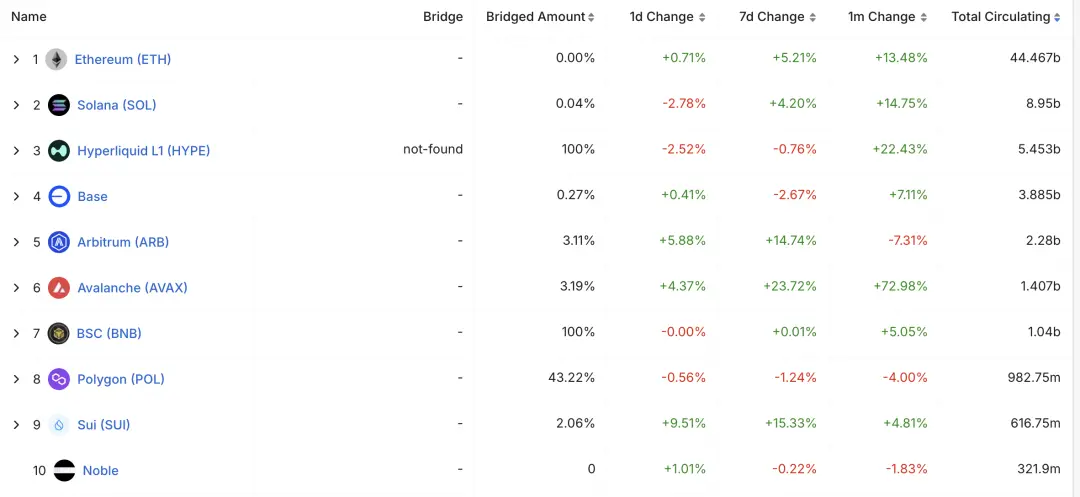
In the past 30 days, USDC has seen a significant increase in AVAX chain and HYPE, which were 73% and 22% respectively, mainly due to on-chain DeFI and exchange demand.
In August 2025, the Avalanche network saw over 2.2 million transactions per day, a record high since February 2024. USDC’s trading volume dominated, accounting for 92% of the top five contracts.
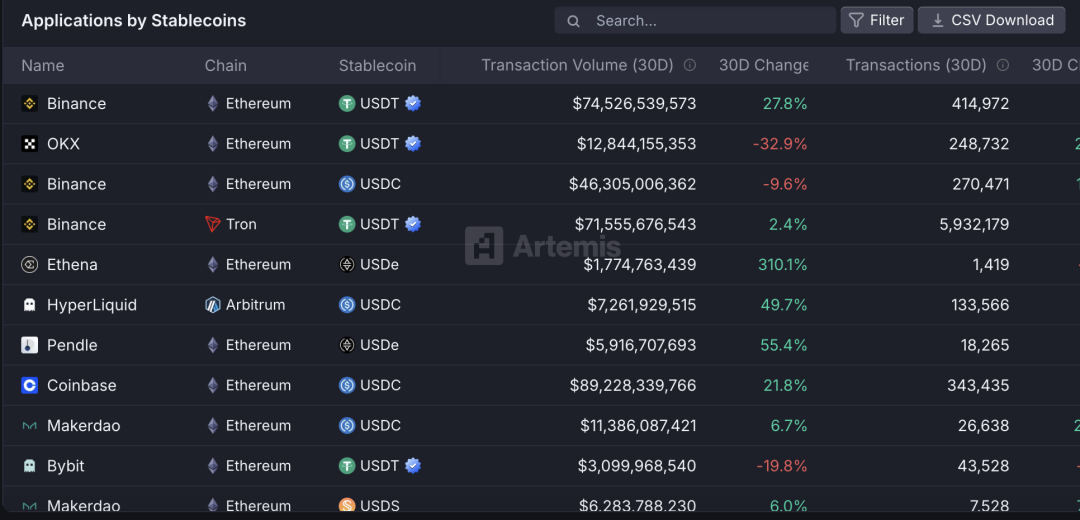
What applications are stablecoins mainly used for?
In the past 30 days, Ethena has seen a relatively significant amount of stablecoin deposits. The core reason is that USDe's high staking yield has attracted a large number of Defi revolving loan players.
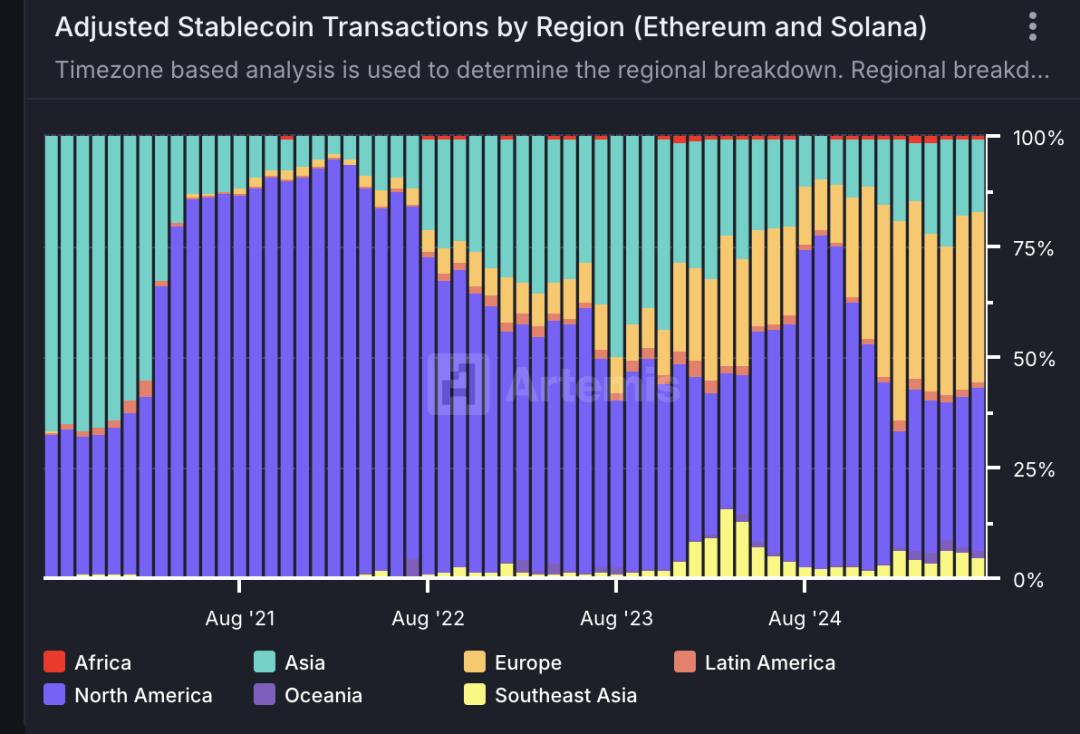
Geographical distribution of stablecoin usage
North America (39%), Europe (37%), and Asia (15%) remain the main markets, with no significant changes in other regions.