Author: ET, Community Researcher at SoSoValue (Agarwood Capital)
I. Introduction
While investors are still searching for emotional and technical explanations for Bitcoin's decline, the real answer has quietly been written into the ledgers of the US financial system: dollar liquidity is experiencing a structural tightening. Specifically, this manifests as...
- The Treasury’s TGA account balance is close to $1 trillion, which has significantly drained market liquidity.
- Short-term funding market pressures surged, with the SOFR–FDTR spread widening to +30bp at one point;
- The Federal Reserve was forced to restart its overnight repo operations, injecting nearly $30 billion in liquidity into the market—the first time since the repo crisis in 2019.
This liquidity vacuum was not accidental; its core cause was the government shutdown. Faced with a budget impasse and the potential risk of a government shutdown, the Treasury preemptively "stockpiled funds," issuing large amounts of bonds to lock cash into TGA accounts, directly withdrawing reserves from the banking system. The amount of available "market dollars" is decreasing, naturally putting pressure on risky assets—Bitcoin became the earliest and most sensitive victim.
However, the scenario is not entirely pessimistic. Historical experience shows that every time the Ministry of Finance replenishes its reserves and liquidity becomes extremely tight, it often foreshadows an impending reversal.
As of November 5th, the number of days the US government has been shut down has broken historical records, and pressure on fiscal, economic, and livelihood issues is rapidly accumulating . SNAP food assistance has been limited, some airport security checks and federal air traffic control services have been temporarily suspended, and public and business confidence has declined simultaneously. Against this backdrop, there are signs of easing tensions between the two parties, especially with the recent pullback in US stocks from their highs, which will help accelerate the resolution of the government shutdown issue.
Market expectations are that the Senate may push through a compromise to end the government shutdown before the Thanksgiving recess on November 15. At that time, the Treasury will restart spending, and the TGA balance is expected to fall from its high, with liquidity returning and risk appetite rising. Bitcoin may be in the "final dip" phase of this correction —at the intersection of the resumption of fiscal spending and the start of a future interest rate cut cycle, a new liquidity cycle will also restart.
II. BTC is facing a dollar liquidity shock.
As a non-interest-bearing asset, BTC is very sensitive to liquidity. Tight dollar liquidity often puts downward pressure on BTC, which is one of the reasons for BTC's obvious weakness since mid-October, especially against the backdrop of the Nasdaq hitting new historical highs.
As shown in Figure 1, as of October 31st:
- The SOFR–FDTR spread turned positive, reaching a maximum of +30bp → The real cost of funds in the interbank market is higher than the policy interest rate ceiling, indicating that banks are borrowing money at a higher cost, resulting in tight liquidity;
- RRP balance rebounds to $50.3 billion → Markets are again turning to the Fed for collateralized liquidity;
Figure 1: SOFR–FDTR Spread and RRP Balance
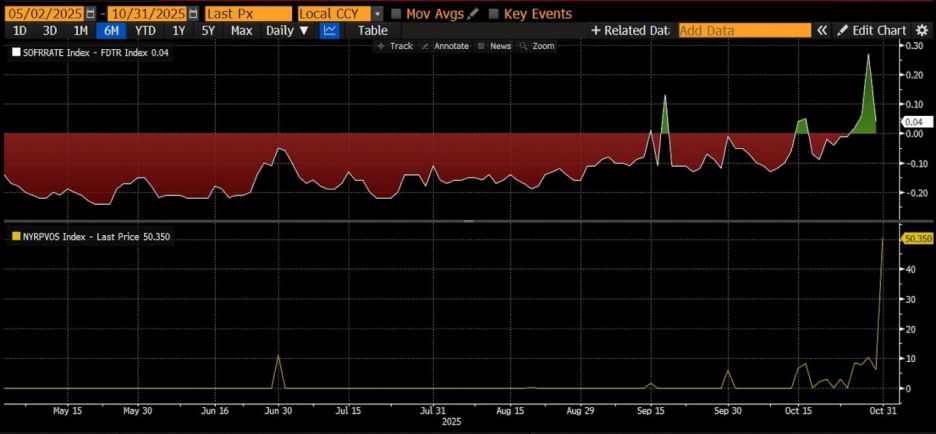
This indicates a clear tightening in the US short-term funding market, forcing the Federal Reserve to restart overnight repo operations, injecting nearly $30 billion in liquidity into the market on October 31.
This is the first such operation since the repurchase crisis in 2019, marking a shift in the liquidity shortage from a temporary phenomenon to a structural problem.
Overall, the macro monetary supply (M2) remains ample, but the safety cushion of bank reserves is being rapidly emptied, and the rise in market lending rates indicates that liquidity pressure is no longer an expectation, but a reality that is already unfolding.
Therefore, observing the liquidity situation will be an important reference for judging the price trend of BTC.
Figure 2: BTC Price and Federal Reserve Liquidity
III. Deconstructing Dollar Liquidity
Dollar liquidity = Bank reserves + Circulating cash = Total size of the Federal Reserve balance sheet - ON RRP (Overnight Reverse Repo) - Treasury TGA account
This is the core framework for observing "disposable dollar balances in the US financial system." It reveals:
Total dollar liquidity = Federal Reserve's "supply side" - Treasury and money market's "absorption side".
The specific components are as follows:
| Components | illustrate | Impact on liquidity |
| Bank reserves | Commercial banks' deposits at the Federal Reserve represent the most direct liquidity within the system. | Increase → Loose liquidity |
| Cash in circulation | Cash held by businesses and individuals. | Generally stable growth with minimal short-term fluctuations. |
| ON RRP (Overnight Reverse Repo) | Money market funds "lend" their funds to the Federal Reserve's short-term tools, which is equivalent to "absorbing" liquidity. | Increase → Liquidity contraction |
| TGA (Treasury General Account) | The Treasury's main account at the Federal Reserve is used for government revenue and expenditure. When TGA rises, it means the Treasury is "absorbing" market liquidity. | Increase → Liquidity contraction |
1. Logical Relationship
This formula actually describes the flow of funds between the Federal Reserve, the Treasury, and the money market:
The Federal Reserve expands its balance sheet → increases reserves and cash → increases liquidity. For example, during QE (quantitative easing), the Federal Reserve purchases assets to increase bank reserves.
TGA increases → Treasury issues bonds to absorb funds → Liquidity decreases. When the government increases bond issuance and tax revenue flows into TGA, market funds are "absorbed".
RRP increases → Money market funds deposit idle money into the Fed → Reduced liquidity is equivalent to money market funds "parking" market funds in the Fed, no longer circulating in the banking system.
therefore:
Liquidity ↑ = Fed Assets ↑ + TGA ↓ + RRP ↓
2. Practical Application
This indicator is key to observing the liquidity cycle of risky assets:
When TGA and RRP both decline, bank reserves surge, dollar liquidity eases, and risk assets (stocks, Bitcoin) typically rise.
When TGA is replenished and RRP rises, liquidity is withdrawn, putting pressure on risky assets.
Specific examples:
Second half of 2023: After the debt ceiling is lifted, TGA restocks → liquidity tightens briefly → US stocks and crypto assets experience volatility.
Early 2024: RRP declines rapidly, funds flow back to banks → Reserve requirements rise → Market risk appetite increases.
3. Further observation: Relationship with the market
| index | Correlation | illustrate |
| S&P 500 / NASDAQ | Positive correlation | Easing liquidity fuels valuation expansion |
| Bitcoin (BTC) | Highly positive correlation | Risk appetite rises when liquidity is loose |
| US Dollar Index (DXY) | negative correlation | When liquidity is loose, the supply of US dollars increases and the index weakens. |
| US Treasury yields | Depending on the stage | QE phases suppress yields; QT phases push yields up. |
4. Conclusion
This formula is actually the liquidity balance equation for the entire dollar system.
The Federal Reserve determines the "aggregate supply".
TGA and ON RRP are two "liquidity valves" that determine how much capital can flow into the financial market.
Therefore, when analyzing the trend of risky assets, it is more important than looking at the Federal Reserve's balance sheet to observe the changes in RRP + TGA, as these are the real drivers of short-term dollar liquidity.
IV. Reasons for Recent Liquidity Tightness – TGA Continues to Attract Funds
Figure 3: Changes in the Balance of the U.S. Treasury TGA Account
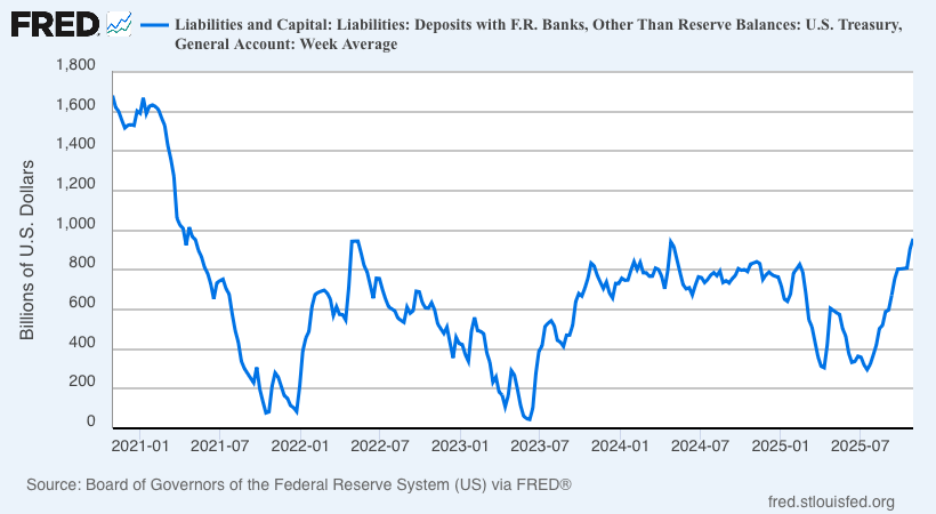
1. Indicator Interpretation
The chart above shows the balance of the U.S. Treasury's main account (TGA) at the Federal Reserve. The horizontal axis represents time (2021–2025), and the vertical axis represents amount (in billions of dollars). This line reflects the Treasury's absorption and release of liquidity, and is an important regulator of dollar liquidity. Below is a complete professional analysis combining the risks of government shutdowns in recent years with fiscal operations.
The fluctuations of this line represent whether the Ministry of Finance is "drawing funds from the market (TGA rises)" or "releasing funds into the market (TGA falls)".
TGA rises → Government absorbs market liquidity (bank reserves decrease).
TGA decline → Government releases market liquidity (increases bank reserves)
therefore:
TGA ≈ Inverse indicator of market dollar liquidity
When TGA rises, market liquidity tightens; when TGA falls, market liquidity loosens.
Combining time and events: Five-year liquidity rhythm from 2021 to 2025
| Time segment | TGA variation characteristics | Background events and their impact on liquidity |
| 2021 Q1–Q3 | Continuing to decline (from 1.6 trillion to 0.2 trillion) | The Biden administration pushed for massive fiscal stimulus, resulting in high Treasury spending and TGA depletion; extremely loose dollar liquidity fueled the rise in stock markets and crypto assets. |
| First half of 2022 | TGA quickly rebounded to ~800 B | The Treasury replenished its inventory to address the risk of a liquidity cap; meanwhile, the Fed launched QT, tightening liquidity and causing the US stock and cryptocurrency markets to weaken. |
| First half of 2023 | TGA plummeted to ~100 B | The US debt ceiling crisis led the Treasury to suspend bond issuance and use cash to pay for expenses; liquidity was released sharply in a short period (bank reserves increased), and Bitcoin rose from 16K to 30K. |
| After summer 2023 | TGA saw a significant rebound (from 100 B → 700 B+). | Following the passage of the debt ceiling agreement, a large amount of bonds were issued to rebuild the TGA, drawing away liquidity; at the same time, the US stock market fluctuated and bond yields rose. |
| 2024 (Full Year) | Moderate fluctuations between 400 and 800 B | Budget negotiations are protracted, and there are threats of partial shutdowns. The Ministry of Finance has adopted "dynamic inventory management," which has caused fluctuations that affect short-term interest rates and liquidity. |
| Since the beginning of 2025 | Rapid rise (approaching 1 trillion again) | The government is making precautionary reserves for new fiscal year spending and potential shutdowns; TGA restocking has tightened liquidity again. |
2. Structural linkage with "government shutdown"
Before closing: The Ministry of Finance increases TGA (Total Gains) as a contingency plan.
When a congressional budget impasse looms and the risk of a government shutdown rises, the Treasury will issue bonds in advance to raise funds and increase the TGA balance to ensure that there is still cash to pay necessary expenditures during the government shutdown.
During this phase, the market will experience short-term liquidity tightening and short-term interest rates rising.
During the shutdown: spending was suspended and debt issuance was restricted.
During the shutdown, some government payments were suspended, and TGA levels remained flat or slightly decreased in the short term. However, due to the lack of new government bond supply in the market, demand from money market funds surged towards ON RRP.
This creates a "structural mismatch in liquidity": the overall liquidity is neutral, but the short end is tight.
After the shutdown ended: Supplementary funding and back pay → TGA plummeted.
After the government resumes spending, TGA (Total Gains) declines, and liquidity is released instantly. Bank reserves rise, repo market pressure eases, and risk assets often rebound during this phase.
For example, after the debt ceiling was lifted in 2023, BTC surged in the short term and the Nasdaq rebounded.
V. The Federal Reserve in Action: Injecting Liquidity
Figure 4. Federal Reserve ON RPs (Overnight Reverse Repos)
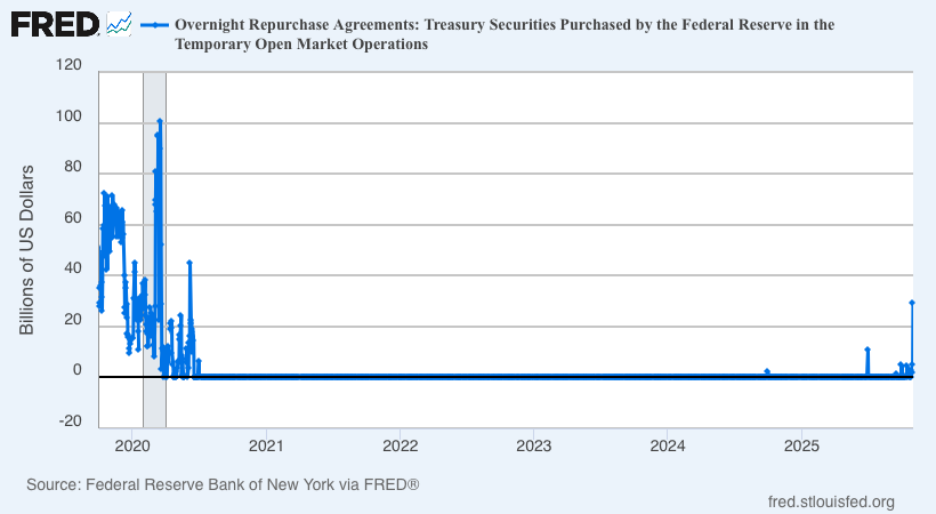
1. Indicator Interpretation
Source: FRED (Federal Reserve Bank of New York)
Latest data (October 31, 2025): US$29.4 billion
For comparison: The peak in September 2019 was $49.75 billion.
This indicator represents the Federal Reserve's provision of overnight cash to major dealers through temporary repurchase operations (collateralized by U.S. Treasury securities), which is a direct means of injecting liquidity.
The tool had been out of use for a long time since the pandemic, and its relaunch this time carries significant policy implications.
2. Three key areas of observation
Policy Background: The Fed's move is a response to a "real shortage" in the short-term funding market. Although QT is about to be discontinued, the continued decline in reserves has exacerbated interbank lending pressure. The resumption of ON RPs signifies: "The Fed is shifting from passive balance sheet reduction to active liquidity management."
Scale characteristics: While $29.4 billion is lower than the level during the 2019 crisis, its symbolic significance is extremely high, indicating that the liquidity gap has exceeded the Fed's observation threshold. If the scale of operations continues to increase in the next two weeks, it can be regarded as a "quasi-policy shift".
Market mechanism:
Banks and money market funds are forced to raise financing rates due to reserve shortages;
The Federal Reserve released liquidity through repurchase agreements, temporarily lowering the SOFR-Repo spread;
If this behavior continues, it will create a "mini-QE" effect .
3. Historical Comparison: 2019 vs. 2025
| index | 2019 Buyback Crisis | October 2025 event |
| Triggering factors | Treasury bond settlement + RRP depletion | Treasury bond settlement + QT leads to reserve depletion |
| SOFR–FDTR Spread | +30bp | +30bp |
| Fed repurchase size | $49.7 billion | $29.4 billion |
| Policy Response | Term Repo + QE Restart | ON Repo + Observing |
| result | Reserves Reconstruction + QE4 Launch | Further observation is needed; liquidity may be gradually replenished. |
VI. Conclusion
1. Currently, TGA accounts are close to 1 trillion, which is the main reason for the recent liquidity shortage. As the government reopens and spending resumes, TGA will decline and dollar liquidity will recover, which is expected to support risk assets such as BTC.
2. Before the government restarts, the Federal Reserve will continue to release liquidity through repurchase agreements to temporarily lower the SOFR-Repo spread and alleviate the tight liquidity situation in the market.
3. The real money betting on the prediction website is in mid-November, that is, from November 10th to November 15th. Goldman Sachs and other institutions predict that the government will reopen within two weeks.
4. Therefore, BTC is very likely undergoing its 'final drop'. At least the reopening of government offices and future interest rate cuts are certain, although the timing and pace are uncertain.