Author: Luca
Compiled by Tim, PANews
Peak of the boom → Recession → Roaring Twenties
Note: The Roaring Twenties refers to the social and cultural developments in Europe and the United States in the 1920s, especially in music and popular culture.
Market outlook for the coming months
First of all, please allow me to introduce my past.
August 5, 2024, September 2024, and April 2025, these plunges have tested my faith, but I am still accumulating chips to meet higher prices.
Because I know this bull market will eventually end with a massive “pump top” that will create FOMO in everyone before the actual top arrives.
My entire analytical framework is built around mood reversals, rapid shifts from uncertainty and anxiety to extreme excitement.
Crypto market makers are well versed in exploiting retail investor sentiment.
The high volatility brought about by the rise, coupled with the bullish narrative, will boost market confidence, expand risk appetite, and ultimately create a frenzy.
I believe this is exactly how market makers will distribute shares in the coming weeks and months to take advantage of the bull market environment.
A clear example of market makers treating retail investors as counterparties dates back to early 2025.
At the time, we were tracking the liquidity trap through on-chain data and price movements, and there were many signs that market makers were preparing for a bigger rally.
While most believe this rally is over, our analysis suggests it is only the beginning.
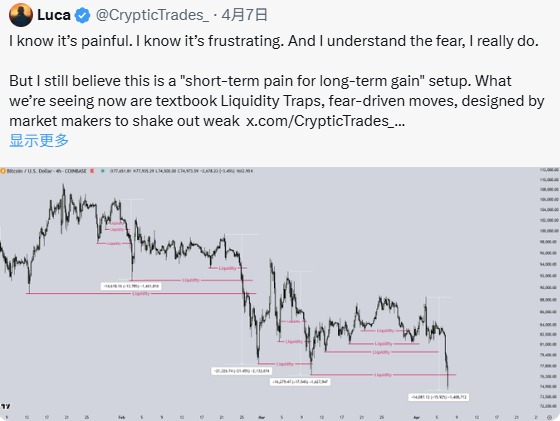
At the time I publicly stated that my cash position was the lowest it had been since the 2022 bear market low because I thought this was an excellent buying opportunity, and it turned out to be the case.
Then, BTC and the entire market hit bottom, and you thought the liquidity trap and market manipulation should have disappeared?
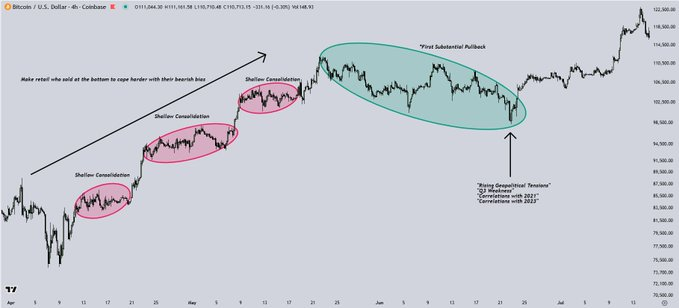
However, this time the reversal of BTC's trend was extremely unusual. The price did not experience any substantial correction. Instead, it rose in a nearly straight line from early April to the end of May and headed straight for a historical high.
Along the way, we’ve seen only simple signs of whipsaws, market actions with one purpose: to create FOMO in those who sold at the bottom and look for opportunities to get back in.
Every brief pause on the K-line is considered a "resistance test."
When the first full-scale correction finally arrived, most market participants had already remained in a bearish mindset and began to actively look for evidence.
Sure enough, the "certainty" news came:
- Heightened geopolitical tensions
- Weak pattern in the third quarter
- Similar trends to 2021
- Similar trend to 2023
This has led many people to believe that the market is about to enter a long period of consolidation, so they have begun hedging before a new round of peaks and record highs.
“Okay, Luca, but how does all this relate?” you might ask.
Well, I think we need to understand how we got to where we are now before we can understand where we're going. Markets behave over long periods of time, and where we've been to get to where we are today is the primary basis for predicting where we're going to go next.
I think all of these liquidity traps, consolidation phases, and bearish sentiment have played and continue to play a key role, collectively contributing to and ultimately driving the sentiment reversal that has taken us to the top of the cycle.
Again, if the sentiment reversal is to shift rapidly from uncertainty to full-blown euphoria, market makers must first create the opposite conditions.
They need to get the majority to go bearish and panic in a low liquidity environment before pushing prices higher, which ultimately sets the stage for a chip distribution.
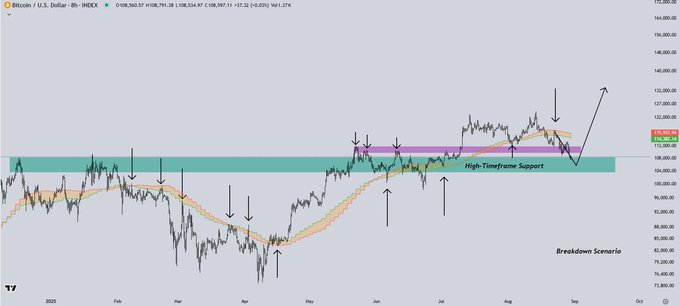
Now, what should we expect next?
From a technical perspective, I believe the most likely scenario for BTC over the coming days is for the price to find a bottom between the November-December 2024 highs, a range that tilts the risk-reward ratio in favor of buyers in the short to medium term.
According to my strategy, I have gradually reallocated the funds in Bitcoin and the funds in overvalued altcoins to altcoins.
From a narrative and emotional perspective, which are always factors I like to consider, this analysis actually makes perfect sense.
It has led the market to believe that a sharp correction is imminent, and this expectation has been reinforced by the “weak September” pattern, which I expect to dominate market sentiment in the coming days.
This situation will likely prompt many traders to hedge or go short before the next big rally, which is why the current market structure makes so much sense to me and why I remain optimistic in the medium term.
“Okay, Luca, I understand this concept of a ‘sentiment reversal’ and it essentially means that price action triggers a sentiment polarization that triggers a reversal, but how does this affect distribution phases and cycle tops?” you might be wondering.
This is where certainty bias comes in. Investors naturally seek out narratives that support their thesis and ignore contradictory evidence, especially during periods of market volatility.
This is exactly what we saw from the bears in late June of this year, who were convinced that a long-term consolidation phase was about to begin, ignoring two key realities: we are in a post-halving year and the overall bullish market structure remains intact.
This is where macroeconomic policy comes into play: the end of quantitative tightening, the shift toward lower interest rates, and the possibility of a soft landing for the economy.
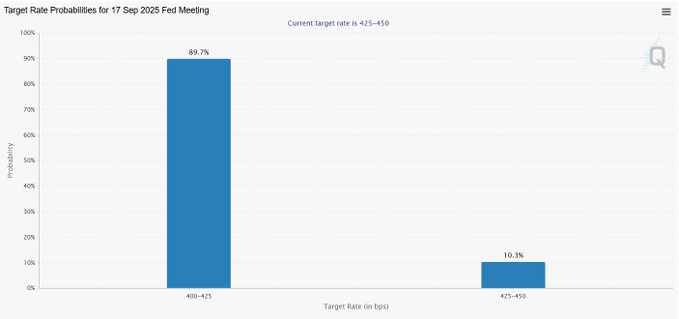
First, if we look at the FedWatch tool on the CME, it currently shows about a 90% probability of a rate cut in September.
Looking back at the S&P 500's price action over the past 30 years, a clear pattern emerges: the past three times the Fed halted quantitative tightening and began cutting interest rates, recessions and massive market crashes followed.
This pattern has appeared 100% of the time in the past 30 years.
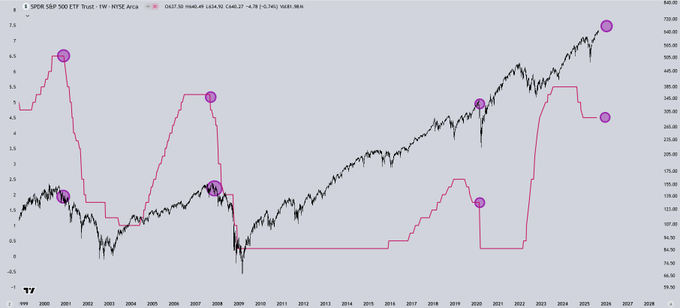
This is because the Fed never intervenes without reason. Whether it is raising interest rates to curb runaway inflation or lowering interest rates to stimulate a weak economy, the Fed's intervention means the same thing: the current economic trend is no longer sustainable and must change.
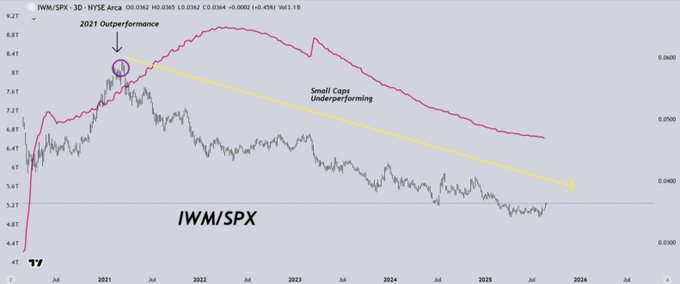
A very telling chart here is the IWM/SPX ratio.
This shows that the performance of small-cap stocks relative to traditional S&P 500 stocks over the past few years essentially reflects the performance of risky assets relative to safer, more mature assets.
Since the Fed began to withdraw its quantitative easing policy in 2021, the IWM (Russell 2000 Index) has continued to underperform relative to the SPX (S&P 500 Index). I believe there are reasonable reasons for this phenomenon, which are mainly influenced by two factors:
Small-cap stocks require low-cost capital:
- Their business models rely on aggressive expansion, which requires cheap financing. With interest rates remaining high and capital costs remaining expensive, many companies are being forced to dilute their equity stakes to stay afloat, and their stock prices reflect this pressure.
Risk appetite collapses:
- Most small-cap stocks are still in their early stages or haven't yet achieved sustained profitability. In an environment of high interest rates and uncertainty, investors have been reluctant to take on this risk. They have instead favored the relative safety offered by large-cap and mega-cap technology stocks.
- This is why small-cap stocks have underperformed the S&P 500 over the past few years.
But here's the interesting thing: I think we're approaching an inflection point.
- The Federal Reserve is preparing to exit quantitative tightening and gradually shift toward stimulating the economy again.
- If this shift materializes, it could be the macro catalyst that reverses the downtrend in small-cap stocks and truly drives money back into risk assets.
The latest macroeconomic data also supports this environment and the view that the economy will experience a soft landing in the coming weeks and months.
GDP grew 3.3% year-over-year, despite downward revisions to the first quarter data. Personal income rose 0.4% month-over-month, while personal spending rose 0.5%.
I think these two numbers are key because they tell us how much "fuel" consumers have left.
Income growth shows how much households are earning, while spending growth tells us how much money is actually flowing into the economy.
I think the economic balance looks healthy at this point, incomes are growing, consumers are still spending, and that's supporting growth.
What impact does this have on traditional stock markets and the S&P 500?
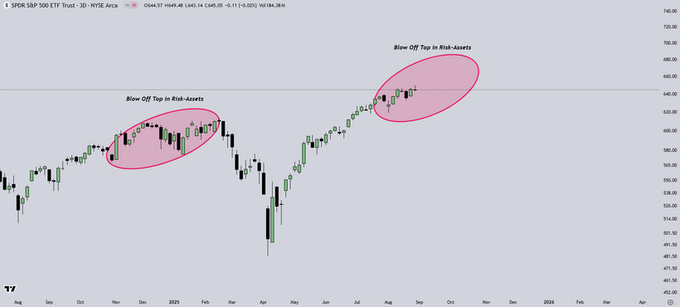
Looking back to October-December 2024, we witnessed a selling top in risk assets, with the subsequent distributions exacerbating the sell-off in early 2025.
I think we are now preparing for a similar situation, just on a larger scale. The impending rate cuts, growing risk appetite, and talk of ending quantitative tightening and adding new liquidity are all driving buying.
In my opinion, this is not the beginning of a new sustainable uptrend. Rather, it is more like another distribution phase, which I expect will eventually lead to a larger final top, and then the market will enter a bear cycle.
Having said that, I think there is still room for upside in the medium term.
I believe we will enter a full-blown risk-on market environment in the coming weeks, which will likely drive FOMO through the roof and create the perfect opportunity for market makers to distribute their holdings.
It is worth remembering that the distribution phase often follows a period of increased risk appetite, which is often driven by bullish sentiment. In the medium term, this dynamic will continue to provide support for risk assets.
I have been maintaining a sizable cash position as I anticipate market volatility and a potential cleanup of the recent influx of long positions. Over the past few days, I have been gradually rebuilding my risk position in preparation for the next leg up.
For me, holding cash means decision-making power. When bearish resonance signals appear, I can reduce short-term downside risks through hedging operations; when there are configuration opportunities with better risk-return, I can adjust the investment portfolio in a timely manner.
At the same time, I'm also preparing for the other side of the cycle. As we move deeper into this phase, I plan to gradually rotate out of risky assets and into more defensive sectors like consumer staples, healthcare, and Treasuries. These sectors have lagged as the market has chased growth and momentum.
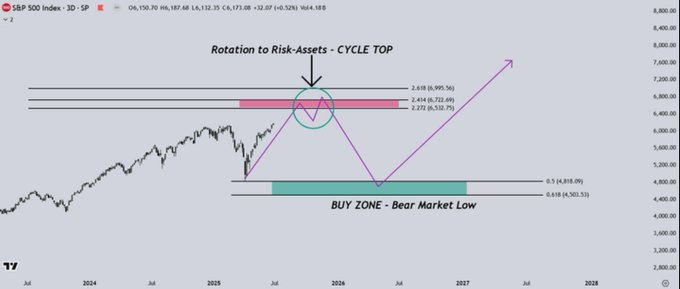
Looking ahead, my target for the S&P 500 is around 6,500 to 6,700, after which the market will enter a phase of sustained distribution and the economy will eventually enter a recession.
After that, I plan to diversify my portfolio until there is a significant market correction and I can weather the bear market.
This would give me the opportunity to re-enter at lower levels and position myself for the next quantitative easing cycle, an environment in which I believe equities and riskier assets will once again outperform.
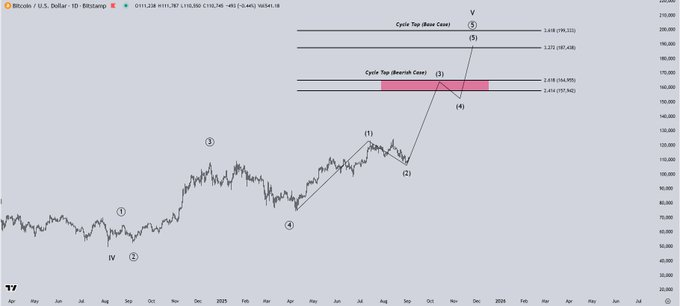
For BTC, my current base case is that the high for this cycle will be around $190,000 before the bear market begins to set in.
I also see another bearish scenario where the price of Bitcoin peaks near $150,000.
There is also a bullish scenario, a so-called “super cycle,” but I would not consider that for now.
In my opinion, this statement is more likely to appear in the frenzy phase at the top of the market rather than being based on current realistic fundamentals.
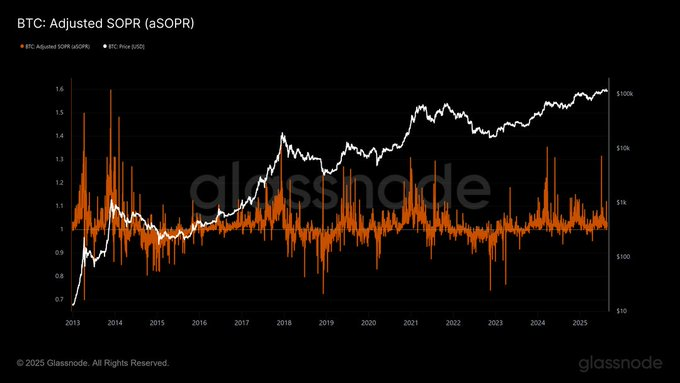
Looking at a key GlassNode metric, the adjusted SOPR (aSOPR), which measures the amount of Bitcoin sold at a profit, I believe provides valuable insight into the stage of the cycle.
At previous cycle tops, we typically see multiple spikes in this indicator, which usually signify large distributions, whereas so far we have only seen one significant spike.
One reason I think altcoins perform so well is that this typically happens when Bitcoin is not in a full distribution phase.
The last time we saw multiple wild swings in aSOPR was in March 2024, during the altcoin boom that saw many altcoins hit cycle highs.
I think once we see a few more of these surges, the risk-reward structure will become more skewed towards altcoins, and this will also indicate that Bitcoin and the entire crypto market are approaching a cycle top.
This will be a key metric that I will be watching closely.
So where does the concept of the Roaring Twenties fit into all this?
I think the macroeconomic backdrop is crucial. We are heading towards a high inflation environment, and the Fed is about to move from quantitative tightening to quantitative easing.
The backdrop is strikingly similar to the 1920s, a decade also characterized by runaway inflation and a productivity surge driven by the Industrial Revolution.
Today, the driving force is the artificial intelligence revolution.
As an entrepreneur, I can say this: AI really does change everything.
What once required a team of dozens of people can now be replaced by a small group of people who know how to maximize the use of AI.
From a historical perspective, rapid economic growth is driven by leaps in productivity. Add high inflation, cheap credit, and ample liquidity to the mix, and you get the full picture.
The next few years are going to be amazing for stocks and other risk assets, but I also think it will lead to the greatest divergence of wealth in history.