
Author: TechFlow
The one-day Binance Life carnival is over.
After the emotions subsided, a few people achieved great results, while most people fell into regret and introspection.
Compared to the short-term regret of not getting on the right train of this hot meme, the failure to hold on to BTC in the long term and obtain stable returns is another "cyclical" regret that occurs every once in a while.
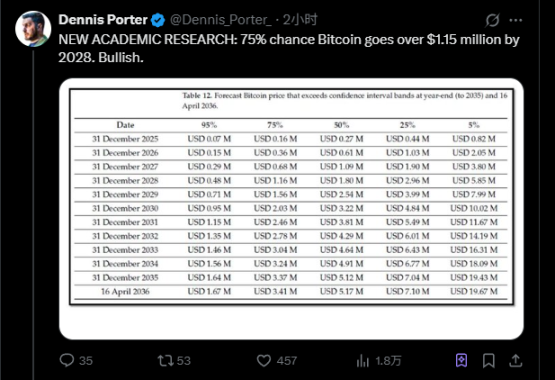
For example, during the National Day holiday, the following prediction chart frequently appeared in social media discussions. Even if you bought BTC three years ago and held on to it, you would still have a good return.

Conservative investors may still be concerned: As a bellwether of the crypto market, how high can BTC go?
Previously, MicroStrategy predicted that Bitcoin would reach $2.4 million in 2036, and ARK Invest made an even more radical prediction of $3.8 million in 2030. These figures have been criticized as overly optimistic or as being based on one's own opinion.
But recently, a relatively more neutral and rigorous academic study provided theoretical support for these predictions.
A recent research paper from Satoshi Action Education (a non-profit research organization) shows that based on pure supply and demand analysis, there is a 75% probability that Bitcoin will exceed $4.81 million in 2036. This is 25% higher than the most aggressive predictions of institutions.
At the same time, the study also predicts that there is a 50% probability that BTC will exceed US$3.35 million in 2030, which is not much different from ARK's forecast of US$3.8 million.
Although theoretical research does not necessarily represent the actual trend, understanding different analytical ideas can also help in asset allocation decisions rather than blindly shouting orders.
$1 million, possibly in 2028
Let’s first talk about some key conclusions of the research.
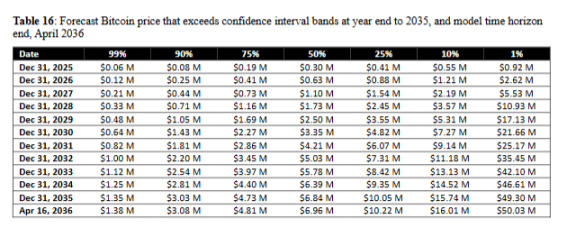
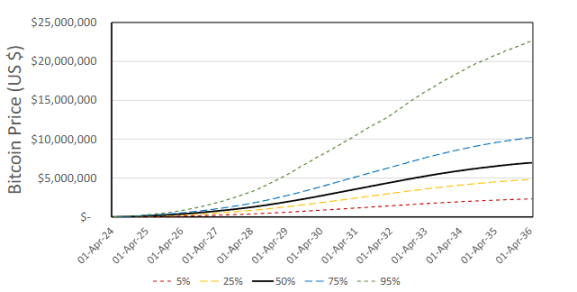
There is a 75% probability that Bitcoin will exceed $4.81 million in April 2036, with a median forecast of approximately $6 million, corresponding to a market capitalization of approximately $125 trillion. This is approximately 6-8 times the current global gold market capitalization.
What’s more important is the timing.
The study predicts that Bitcoin will most likely break through $1 million between the end of 2027 and the end of 2028. Specifically, under a 50% probability (median) scenario, Bitcoin will reach $1.1 million by the end of 2027;
With a 75% probability, this milestone occurs in 2028. This roughly aligns with ARK Invest's forecast of $3.8 million in 2030.
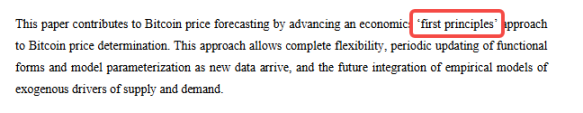
Unlike institutional forecasts, this study focuses more on the supply and demand changes of Bitcoin, which is the first principle in the economic sense. To be more specific:
Without looking at the historical price trend of Bitcoin, nor presuming that it will replace the market share of gold or other assets,
Instead, it simply calculates how the supply and demand equilibrium point evolves over time based on the fixed supply cap of 21 million (supply) and current observable purchasing behavior (demand), such as ETF inflows, corporate purchases, and miner hoarding.
The biggest advantage of this approach is that all key variables can be tracked and verified continuously.
The daily net inflow of ETFs is available from public data from financial terminals such as Bloomberg. Exchange balances can be queried in real time through on-chain data. The proportion of long-term holders is available from statistics from analysis platforms such as Glassnode and CryptoQuant.
It is worth noting that the research conclusions based on this supply and demand model are of a similar order of magnitude to the forecasts of institutions using completely different methodologies.
MicroStrategy's Bitcoin24 model assumes that the Bitcoin price growth rate decreases year by year, and its baseline scenario also predicts that BTC will reach US$2.4 million in 2036.
Institutions are buying at a rate 10 times the supply
The opposite of supply contraction is strong purchasing demand. The study calculated the average daily purchase volume of various buyers:
US spot Bitcoin ETFs saw an average daily net inflow of approximately 2,900 Bitcoins in July 2025. As of July 29, 11 ETFs collectively held approximately 1.485 million Bitcoins, representing 7.1% of the total supply. BlackRock's IBIT held over 730,000 Bitcoins.
As of July 28th, the top 100 publicly traded companies held a combined total of over 923,000 bitcoins. MicroStrategy (now Strategy) alone holds over 607,000 bitcoins, continuing to increase its holdings at a current rate of approximately 1,000 bitcoins per day. Some bitcoin mining companies are also hoarding their output: Marathon mined 950 bitcoins in May 2025 but sold none, resulting in a net increase of approximately 31 bitcoins per day that month.
Adding up ETF inflows, corporate purchases, miner hoarding and retail purchases, the study estimates that between 5,000 and 6,000 bitcoins are currently being withdrawn from circulation every day.
After the fourth halving, miners can only mine 450 new coins per day, which means that the daily demand is 11-13 times the daily supply.
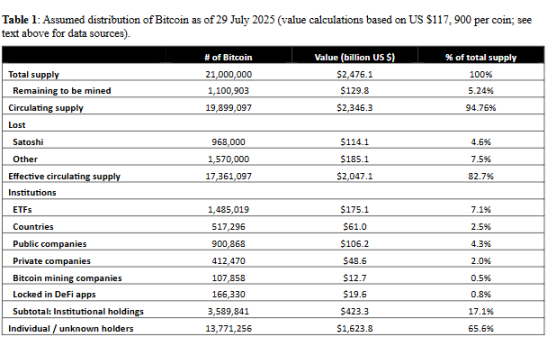
But the more critical question is: How many of the 19.9 million mined bitcoins are actually circulating in the market?
As of July 29, 2025, 19.9 million bitcoins have been mined, and the remaining 1.1 million will be slowly released over the next 115 years.
Statistics from the research team show that approximately 970,000 coins mined by Satoshi Nakamoto in the early days have never been moved and are generally believed to be inaccessible; a conservative estimate is that approximately 1.57 million coins have been permanently lost due to loss of private keys; of the remaining 17.36 million "effective circulating supply", 14.4 million coins have not been moved on the chain for more than 155 days and are classified as "illiquid supply".
These 14.4 million "sleeping" bitcoins are the biggest uncertainty.
The study assumes that 40% of them (about 5.76 million) will permanently exit the market, and may be used as corporate strategic reserves, DeFi protocol collateral, or locked up for a long time as a credit basis.
Based on this calculation, the supply that may actually flow back into the market is approximately 8.64 million coins. Adding the 3 million coins currently known to be circulating on exchanges, the total circulating supply is approximately 11.64 million coins.
This imbalance between supply and demand is not a theoretical deduction, but a reality that is happening at an accelerating pace.
On-chain data shows that the illiquid supply increased from 13.9 million on January 1, 2025, to 14.37 million on June 26, 2025, equivalent to approximately 2,650 coins flowing into long-term holdings per day. Statistics show that 70-90% of these Bitcoins transferred out of exchanges have not moved for more than 155 days.
Once they leave the exchange, they are likely not to come back for a long time.
A similar supply contraction has already occurred in 2019-2020: Bitcoin continued to flow out of exchanges, and the liquid supply gradually tightened.
MicroStrategy started buying in August 2020, Square entered the market in October, and in the following months the price accelerated from $10,000 to $69,000 at the beginning of 2021. The current contraction is even faster.
If the pace of ETF and corporate buying continues, coupled with the effect of miners cutting production, the decline in liquid supply will be steeper than in the previous cycle.
At the current rate, prices may rise rapidly in 3-5 years.
The core finding of the study is that when the circulating supply drops below 2 million, the price may enter a nonlinear growth phase.
Why is it the number 2 million?
By simulating different daily amounts of BTC exiting circulation, the study found that when there are fewer than 2 million tradable bitcoins on the market, each new buy order will significantly push up the price, and the price increase will incentivize more people to hoard the coins and not sell them, forming a self-reinforcing positive feedback loop.
Once in this range, every purchase by an additional buyer will have a disproportionate price impact.
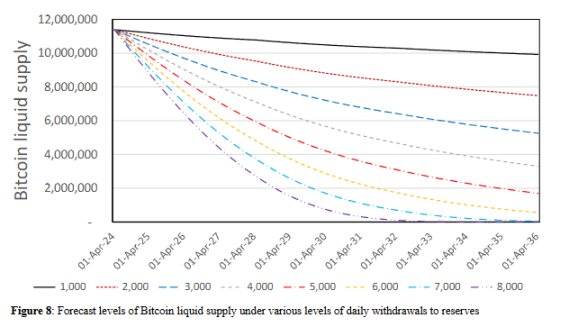
Specifically, let’s look at the prediction results for 2036 under different withdrawal rates:
- If 1,000 coins are withdrawn from circulation every day (well below current levels), there will be 9.92 million coins in liquid supply by 2036, with a price of approximately $1.39 million and an annualized yield of 29.11%; this is a relatively moderate growth path.
- If 2,000 coins are withdrawn from circulation each day (close to the baseline assumption of the study), there will be 7.48 million coins remaining, with a price of $1.6 million and an annualized yield of 30.64%.
- If 4,000 coins are withdrawn from circulation every day, there will be 3.3 million coins remaining, with a price of US$2.41 million and an annualized yield of 35.17%.
- When the daily withdrawal of 6,000 tokens from circulation reaches 6,000 (around the current actual level), the circulating supply will drop to 560,000 tokens, and the price will soar to $5.86 million, with an annualized yield of 45.57%. This is close to the critical point.
From a time perspective, at the current rate, this critical point may be reached within 3-5 years.
Research shows that if the daily withdrawal of coin circulation remains at 6,000, the circulating supply will drop below 2 million by the end of 2029; if the withdrawal rate is accelerated to 7,000, this time point will be brought forward to 2028-2029.
More intuitive is the change in price trajectory.
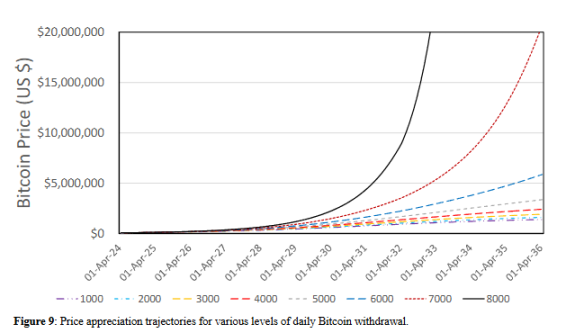
In all scenarios where less than 6,000 coins are withdrawn from circulation per day, the price curve maintains a relatively smooth upward trend.
However, once the withdrawal of the circulating supply reaches 7,000, the price curve will begin to bend upward significantly in 2032;
When the rate reaches 8,000 pieces per day, this curvature will appear in 2030 and will rise almost vertically after 2032.
Amidst the selling pressure, will the 14.4 million dormant BTCs wake up?
The study does not believe that accelerated price increases will necessarily occur. The biggest uncertainties are:
Of the 14.4 million bitcoins that have not been moved for more than 155 days, how many will flow back into the market when the price rises?
The study assumes that 40% of them (about 5.76 million) will permanently exit the market, such as being used as strategic reserves by companies, used as DeFi collateral, or the private keys are truly irretrievable.
However, this assumed ratio is not necessarily correct, so the paper conducted 10,000 simulations, randomly varying the initial liquid supply between 5 million and 13 million coins. The results show:
Even in the most optimistic scenario (13 million coins in circulation), there is still a 50% probability that the value will exceed $6 million in 2036.
The second variable is whether buyers will be relentless. When Bitcoin rises from 120,000 to 500,000 and then to 1 million, will institutions continue to buy 2,900 coins per day?
The study set a parameter to measure this: if prices tripled and buyers cut their purchases in half, the price in 2036 could be only $1.39 million.
At present, institutional buyers are not sensitive to prices.
The pace of buying by ETFs and public companies remained largely unchanged during the period when Bitcoin's price rose from $65,000 to $118,000 (an 81% increase). If this pattern persists, price increases may not be enough to curb demand.
Which Bitcoin indicators should you watch?
The value of this study lies not only in providing a price figure, but also in providing a set of indicators that can be monitored continuously.
Since all key variables of the model are based on public data, investors can track in real time which direction the market is evolving.
The study recommends focusing on four core indicators:
Bitcoin balance on exchanges
Platforms like Glassnode and CryptoQuant provide daily updates on Bitcoin holdings on major exchanges. If this number continues to decline and approaches 3 million (its current level), it means that the liquidity supply is tightening.
The key is to observe the rate of decline. If the monthly reduction exceeds 100,000-150,000, at the current pace, it will approach the critical zone of 2 million within 3-5 years.
ETF net inflow data
Financial platforms like Bloomberg publish daily data on the capital flows of 11 US Bitcoin spot ETFs. If the average daily net inflow remains above 2,000-3,000 Bitcoin, this is a strong signal in itself.
Institutional demand has not weakened due to price increases. On the contrary, if ETFs begin to experience sustained net outflows, it may mean that price sensitivity is increasing and the market is self-regulating.
Long-term holder supply share
On-chain analytics platforms track the percentage of Bitcoin that hasn’t moved in over 155 days. Currently, that number is around 72% (14.4 million / 19.9 million).
If this ratio continues to rise and exceeds 75%, it means that more and more coins are being withdrawn from circulation. More importantly, it’s important to observe the growth rate: in the first six months of 2025, the illiquid supply of BTC increased from 13.9 million to 14.37 million (approximately 2,650 coins per day). If this rate accelerates to 3,000-4,000 coins per day, it’s time to be vigilant.
Comprehensive calculation of daily BTC net withdrawal from circulation
By adding up the ETF inflows, purchases disclosed by listed companies, and miner hoarding data, and subtracting the new supply (at the mining rate, about 450 coins/day), we can roughly estimate how many coins are withdrawn from circulation every day.
If this number stabilizes at 5,000-6,000, we are in the middle scenario of the research forecast; if it exceeds 7,000 and persists for several months, we may be approaching the trigger conditions for accelerated growth.
Of course, this research has limitations. For example, the impact of derivatives and credit intermediation has not yet been fully incorporated into the model. Furthermore, all of these predictions are based on the assumption that there are no major black swan events, such as protocol loopholes or regulatory bans.
But even taking these uncertainties into account, the direction of change in supply and demand fundamentals is clear:
The addition of 450 coins per day is guaranteed by the agreement, institutions buying thousands of coins every day is public data, and the shrinking liquidity supply is visible on the chain.
Let’s go back to the question at the beginning of the article: How high can Bitcoin go?
Overall, the study doesn't offer a definitive answer, but it does reveal a mechanism:
When the fixed cap of 21 million coins meets growing institutional demand, the price may enter a phase of nonlinear growth. There is a 75% probability of $4.81 million in 2036, but more importantly, the milestones along the way, such as $1 million in 2028 and $3.35 million in 2030, are crucial.
Anyone who bought at any price three years ago and held on would still be making money today.
Perhaps years from now, looking back, today's price of $120,000 will become another moment of "Why did it seem so expensive back then?" Or perhaps the market will prove that models are, after all, just models.
Only time will tell. But at least now, you know which numbers to look at.
