Source: Coinbase
Compiled by: Golden Finance
Coinbase believes that this week's macroeconomic data has weakened market expectations for a sharp interest rate cut, the US dollar has strengthened, and the financial environment has tightened.
The Bureau of Economic Analysis (BEA)'s third advance estimate raised the annualized growth rate of US GDP in the second quarter to 3.8%, indicating stronger underlying demand than previous data had suggested. Meanwhile, durable goods orders rebounded 2.9% in August (excluding a 0.4% increase in the transportation sector), while core capital goods orders (a key measure of business investment) rose 0.6%. Initial jobless claims fell to 218,000 that week, suggesting a weakening labor market, but not as much as previous data had suggested.
Taken together, we believe these data suggest stronger-than-expected economic growth and labor conditions, weakening the case for rapid monetary easing amid persistently high inflation. Markets appear to be pricing in this shift: interest rates edged higher, the US dollar index neared a three-week high, US dollar liquidity tightened slightly, and cryptocurrency prices retreated.
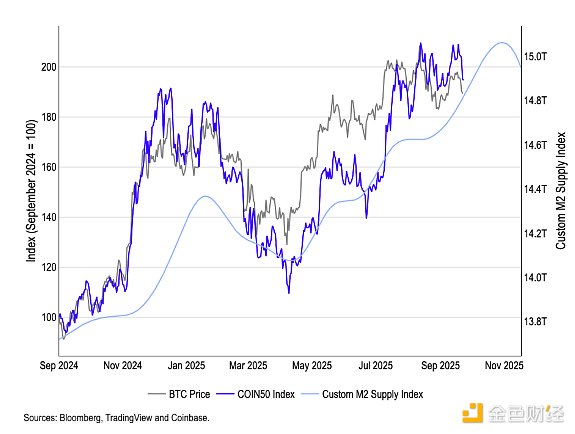
From a more global perspective, Coinbase's customized M2 Liquidity Index suggests that liquidity headwinds will emerge starting in November. Our customized Global M2 Liquidity Index (which optimizes money supply growth and leads Bitcoin by 110 days) has begun to inflect downward in November. Given that the index has a correlation of approximately 0.9 with BTC over a one-month to three-year timeframe, we believe the inflection point is likely to foreshadow liquidity headwinds heading into year-end (Figure 1). However, the index also suggests healthy liquidity conditions in October, which could support risk assets in the short term.
Figure 1. The M2 liquidity index is expected to begin declining in early November.
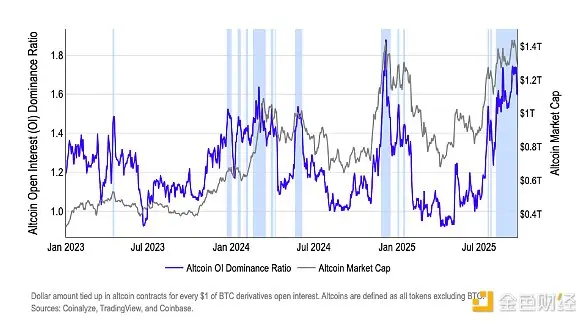
Beyond macro factors, we believe this week's cryptocurrency liquidations were driven by positioning pressure, which has been building for several weeks and is flashing warning signs. As discussed in a previous article, altcoin open interest dominance is well above the 1.4 threshold, which typically signals large-scale liquidations. Last weekend, the ratio reached 1.7, following which we saw approximately $1.8 billion in forced liquidations of long positions as long positions were liquidated across the market (Figure 2).
Even after the unwinding, the ratio remained elevated at 1.6, which we believe highlights the continued need for cautious positioning ahead of upcoming data releases that could impact interest rates and the USD.
Figure 2. Altcoin Open Interest Dominance Ratio