
Monday's liquidation event resulted in the liquidation of more than $1 billion in leveraged long positions, with derivatives and macroeconomic indicators becoming the key to determining future market trends.
Spot prices hovered around $112,965, down about 10% from recent highs. The market is digesting the impact of last week's Federal Reserve rate cut and the rebound in volatility.
This correction began in the futures market, where forced liquidations significantly reduced long positions across major exchanges. Over $1.6 billion in long positions were liquidated, bringing open interest down from cyclical highs. This resulted in a reduction in the notional open interest base across Binance, Bybit, and CME, but it still remained substantial.
The Coinglass dashboard shows that the open interest in BTC futures contracts continues to decrease, the funding rates of major perpetual contracts are converging towards a neutral level, and the liquidation heat map shows a distribution trend clustered around the spot price.
Options markets repricing shocks
Deribit’s analytics platform and Laevitas’ 25Delta skewness data show that short-dated put options are trading at a premium to call options, a structure that reflects both demand for downside protection and that suggests market makers are maintaining negative gamma positions around the spot price.
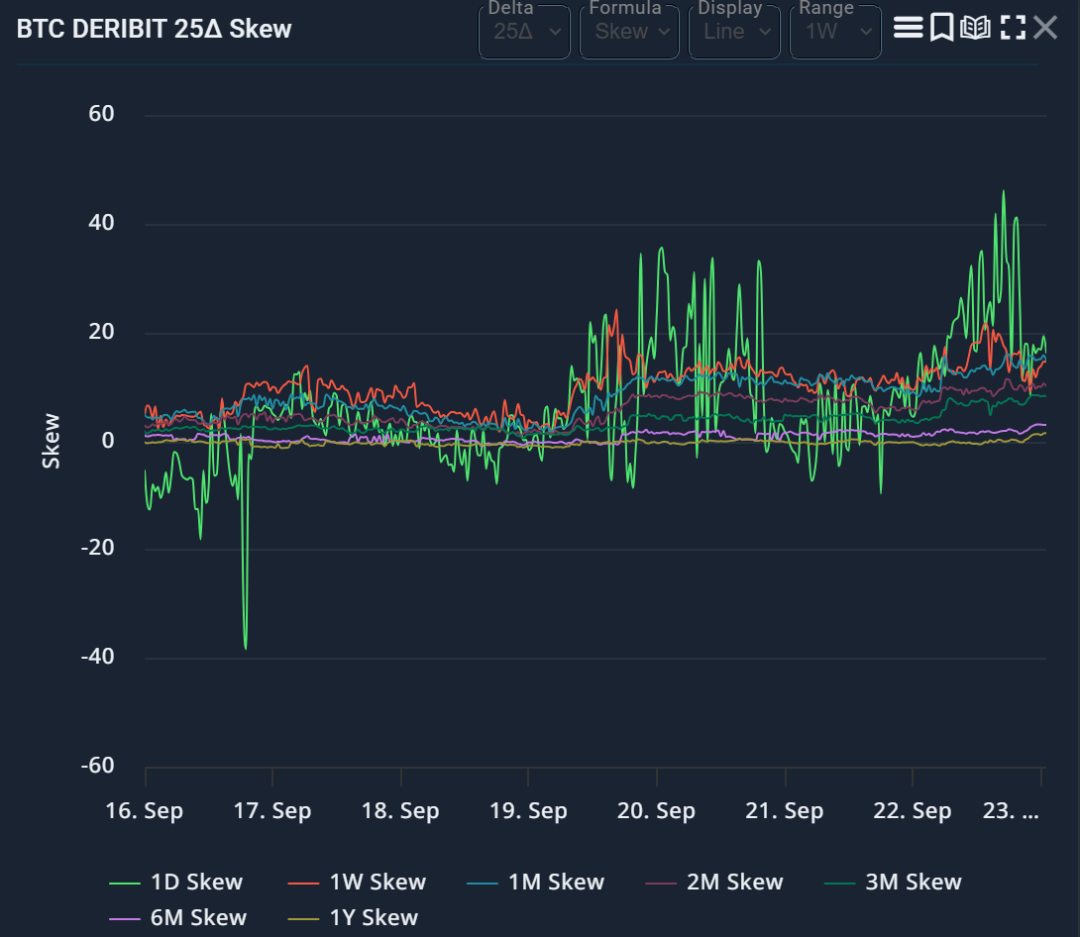
When the spot price is in the negative Gamma range, this configuration will usually expand the intraday volatility. Once the price stabilizes and Gamma turns positive, the volatility will tend to be flat.
Fund flows aren't always one-way. Farside Investors data shows that US spot ETFs experienced a rare September net outflow of approximately $51 million on Wednesday, September 17th. Of this, IBIT attracted approximately $150 million, while FBTC and GBTC experienced redemptions.
Funds subsequently returned on Thursday and Friday, with a total inflow of $385 million before the weekend. Such divergent data may curb short-term momentum, but if overall fund inflows resume, medium-term buying support will remain.
Basis and term structure are indicators of a healthy fourth quarter. CryptoQuant's CME annualized basis series (a measure of arbitrage demand) has fallen from its mid-September high. It remains to be seen whether it will remain at a low level of 10% or above, which would indicate a healthier position structure.
If the basis rebounds quickly to a high of over 15%, it would indicate that leverage is accumulating again during the rebound.
Macroeconomic factors still have a marginal impact. After the Federal Reserve cut interest rates by 25 basis points, the yield on the 10-year U.S. Treasury bond hovered in the low 4% range, and the U.S. dollar index strengthened in the new week.
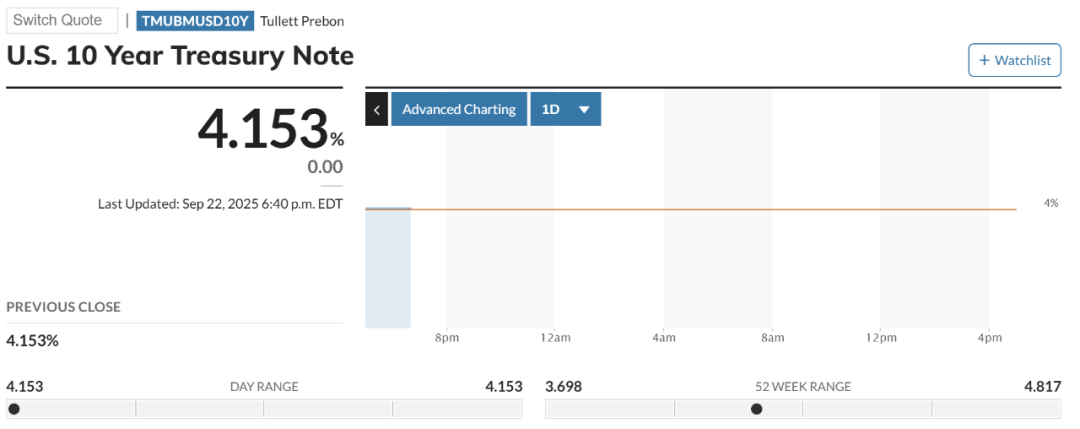
If this trend continues, it could suppress the beta performance of the crypto market. According to MarketWatch's 10-Year Treasury Bond page, the 10-year yield remained around 4.1%, and the US dollar index strengthened in tandem with cautious stock index futures.
These data provide tactical resistance to rapid upward momentum, but their impact tends to be intermittent when crypto markets are driven by positioning.
Taking all these factors into consideration, the path analysis at the beginning of the fourth quarter can be summarized into two competitive ranges corresponding to obvious liquidation ranges and market maker positions:
Scenario A: Bounce Squeeze
This pushed the spot price up to the $118,000-124,000 range, which overlaps with the liquidation cluster and the common gamma friction points at round numbers on the Coinglass heat map.
Trigger conditions include: funding rates remain stable at zero or negative on rising days, direct short positions are moderately rebuilt, skewness drifts towards neutral, and ETFs maintain stable net inflows for several consecutive days.
These conditions will convert the remaining open interest into upward momentum, and the market will enter a range-bound trading session after Gamma turns protective.
Scenario B: Second dip
The price fell to the $104,000-108,000 range, where the liquidation density is lower than the recent low. There is a risk of continued negative skewness, weak ETF flows, and a strengthening of the 10-year Treasury yield and the US dollar index.
Under this path, funding rates on major platforms will turn from neutral to negative on a down day, and implied volatility will remain high (as market makers maintain negative gamma below $115,000). This combination will continue to be downside path dependent until open interest decreases further or options inventory reverses intraday volatility.
Position sizing on regulated platforms can serve as effective cross-validation
The CME Bitcoin futures page shows deep liquidity and sustained participation, providing a reference for institutional activity in the September quarter-end rollover of options and futures.
A decline in the CME basis coupled with stable open interest suggests normalization of positions rather than widespread deleveraging; a sharp decline in open interest would confirm a broader reset.
Seasonal factors affect the baseline probability. Coinglass's monthly return chart shows that October historically has mostly achieved positive median returns, earning it the nickname "Rising October" among traders.
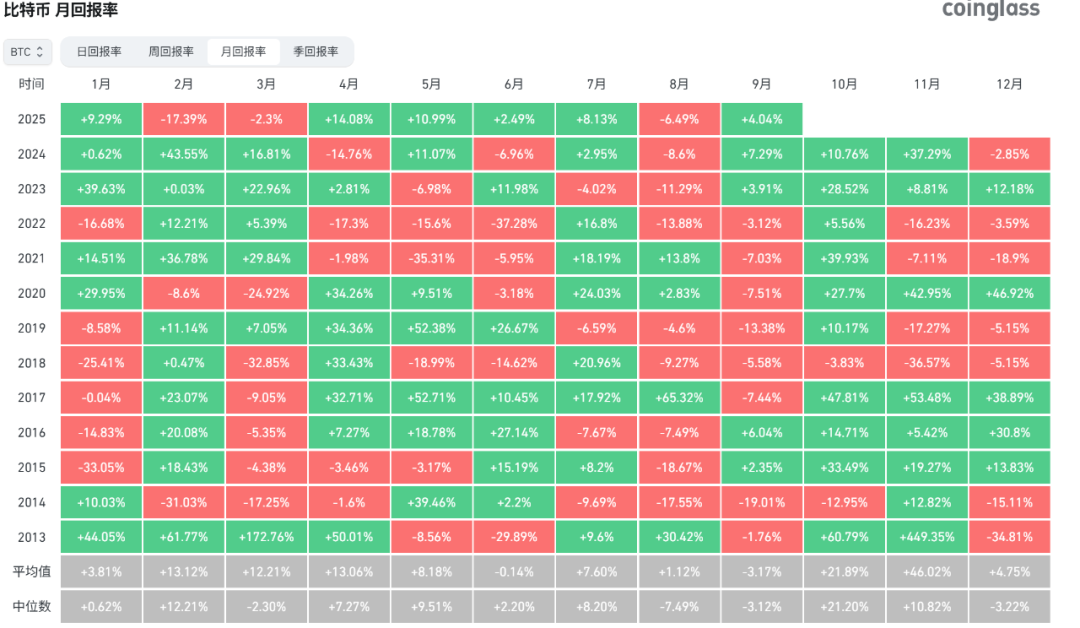
Seasonality itself does not drive the market, but if combined with a healthier derivatives structure, it can increase the probability of a recovery path after the sharp fluctuations in September.
The key question now is whether leverage is adequately balanced to protect the spot market from excessively reflexive volatility. Coinglass data shows that even after weekend liquidations, open interest remains above the yearly average, funding rates have eased but not collapsed, and heat maps indicate actionable clusters within the 5%-8% range above and below the spot price.
Farside's ETF book still shows differentiation rather than unidirectional flow, CryptoQuant basis series is in the observation range, Laevitas and Deribit skewness reports still show that put options are dominant. If prices gradually rise and shorts are forced to chase the rise, this configuration may be quickly reversed.
The near-term market trend will depend on position signals: if the funding rate remains stable at zero, ETFs have net inflows for several consecutive days, and the normalization of skewness pushes the negative gamma range upward, then squeezing to $124,000 will become the dominant path.
If Treasury yields and the dollar remain strong, skewness remains negative, and ETF flows fluctuate, downward pressure towards $108,000 will build. Traders closely monitoring the same dashboard will quickly discern the actual path.
