Author: YQ
Compiled by Tim, PANews
In my three previous analyses of the October 11th crypto liquidation wave, I've examined the issues of oracle failure, infrastructure collapse, and potential coordinated attacks. Today, I'll focus on perhaps the most critical yet overlooked dimension: how market makers, supposedly responsible for maintaining market stability, became the primary drivers of the unprecedented liquidity vacuum that ultimately transformed a manageable correction into a $19 billion disaster.
Understanding Market Makers: Theory and Reality
Before examining the October 11th crash, it's important to understand the fundamental role of market makers. In traditional financial markets, market makers are financial instruments that continuously quote bid and ask prices. Acting as intermediaries between bid and ask prices, they profit from the spread between bid and ask prices and also play a crucial role in maintaining market liquidity.
The theoretical roles of a market maker include:
- Continuous Price Discovery: Maintaining two-way quotes that reflect fair market value
- Liquidity provision: ensuring traders can buy or sell at any time without significant price impact
- Volatility Smoothing: Absorbing Temporary Supply and Demand Imbalances
- Market efficiency: Maintaining uniform pricing through cross-platform arbitrage of price differences
In crypto markets, market makers operate in a similar manner but face unique challenges:
- All-weather market, never closed
- Liquidity fragmentation across hundreds of exchanges
- Extreme volatility compared to traditional assets
- Limited supervision and liability
- Technical infrastructure requirements for high-frequency trading
Under normal market conditions, this system works quite well. Market makers earn a small profit by providing necessary liquidity. But what happened on October 10-11 shows what happens when incentives and accountability misalign.
Timeline of Liquidity Disappearance
The precise withdrawal behavior of market makers during the October 11th crash suggests a coordinated move rather than panic. Here is a detailed timeline of how liquidity evaporated:
4:00 AM Beijing Time: News of Trump's announcement of a 100% tariff on Chinese imports swept social media. Bitcoin subsequently fell from $122,000. Market makers maintained their positions but began widening bid-ask spreads, a standard defensive move.
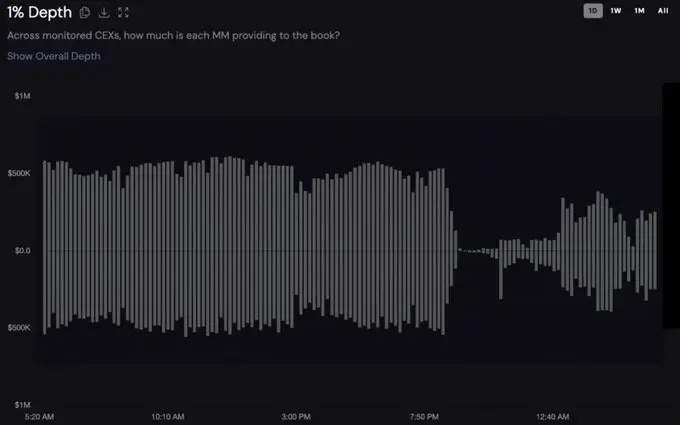
Binance's unnamed token, Unnamed_0, has a 1% bilateral depth chart over the past 24 hours. Buy orders are below the x-axis, while sell orders are above it. Data source: Coinwatch.
4:40 AM Beijing Time: Real-time tracking data shows the beginning of a catastrophic liquidity withdrawal. The market depth of a major token plummeted from $1.2 million.https://x.com/coinwatchdotco/status/1977300622933377291?s=46&t=Bc8iVMf_sEJWxhSskA5TiA
5:00 GMT: A critical turning point. As the US market opened, the macroeconomic environment deteriorated dramatically. Institutional participants withdrew liquidity, causing bid-ask spreads to widen significantly and order book depth to plummet. It was at this point that market makers shifted from defensive positioning to a full-scale exit.
5:20 AM Beijing Time: The market was in extreme chaos. Almost all tokens caught in the global liquidation wave hit their lowest point at this moment. Market depth for tracked tokens plummeted to $27,000—a 98% drop in liquidity. When liquidity providers withdrew from the $108,000 support level, some altcoins saw declines of up to 80%.
5:35 AM (GMT+8): As the most intense sell-off drew to a close, market makers began cautiously returning to the market. Within just 35 minutes, the order book depth on major centralized exchanges had recovered to over 90% of its pre-event level. However, by then, the market had already suffered its greatest impact.
The above timeline reveals three key takeaways:
- Market makers have 20-40 minutes of warning time before funds are fully withdrawn
- Multiple institutions withdrew their investments simultaneously.
- Liquidity only recovered after favorable re-entry points emerged
When the insurance fund fails: ADL is triggered continuously and on a large scale
When market makers retreat and liquidated orders flood the order book, the exchange activates its last line of defense: automatic liquidation (ADL). This mechanism is crucial to fully understanding the full context of the October turmoil.
How does Automatic Deleveraging (ADL) work on centralized exchanges?
ADL is the third and final level in the liquidation hierarchy.
The first level—the order book forced liquidation mechanism—is a mechanism whereby when a position falls below the maintenance margin requirement, the exchange will execute a forced liquidation through the order book. If the liquidation price is better than the bankruptcy price (i.e., the price at which the margin is zeroed), the remaining funds will be deposited into the insurance fund.
Secondary — Insurance Fund: This fund absorbs losses when the order book is illiquid. This fund, accumulated through forced liquidation during normal times, serves as a buffer against bad debts.
Level 3 - Automatic Position Deleveraging: When the insurance fund cannot cover losses, the exchange will force liquidation of profitable positions.
Automatic reduction ranking system
Binance’s automatic deleveraging mechanism uses a sophisticated ranking formula:
ADL ranking score = position profit and loss percentage × effective leverage
in:
- Position profit and loss percentage = unrealized profit / absolute value of position notional value
- Effective leverage = absolute notional value of position / (account balance - unrealized losses + unrealized profits)
Bybit does something similar, but adds an extra safeguard: the platform displays a user’s percentile ranking via a five-level indicator light.
- Tier 5 = Top 20% (highest priority for automatic position reduction)
- Fourth gear = 20%-40%
- Third tier = 40%-60%
- Second level = 60%-80%
- First Tier = Bottom 20% (lowest priority for automatic deleveraging)
The cruel irony is that the top traders with the greatest profitability and the highest leverage usage are the first to face forced liquidation.
October ADL Storm
From October 10th to 11th, the scale of ADL coverage was unprecedented:
- Hyperliquid: Cross-margin ADL enabled for the first time in over two years, impacting over 1,000 wallets
- Binance: Large-scale launch of ADL
- Bybit Report: Over 50,000 Short Positions Liquidated, Totaling $1.1 Billion
- BitMEX: This is an exception. Due to the huge insurance fund, only 15 contracts will be ADLed.
The timing of the market maker withdrawal is undeniable. Between 05:00 and 05:20, as order book liquidity dried up, liquidation orders could not be completed normally, resulting in the insurance fund being instantly depleted, triggering the automatic position reduction mechanism.
Case Study: Cascading Risks
Consider what happens to a typical hedge portfolio during these critical 35 minutes.
At 5:00 Beijing time, a trader's position:
- Long BTC: $5 million, 3x leverage
- Shorting DOGE: $500,000, 15x leverage (hedged in a profitable state)
- Long ETH: $1 million, 5x leverage
5:10 AM Beijing Time: Market makers retreat. DOGE flash crashes, and short sellers profit handsomely. However, due to high leverage and combined profits, the automatic position reduction mechanism is triggered.
5:15 Beijing time: The Dogecoin short position was forcibly closed through the automatic deleveraging mechanism, and the portfolio has lost its hedge protection at this time.
5:20 Beijing time: Due to the lack of hedging, the long positions of Bitcoin and Ethereum were liquidated in succession, eventually leading to the annihilation of the entire investment portfolio.
This pattern played out thousands of times, with sophisticated traders who had carefully planned their positions seeing their profitable hedged positions liquidated by the ADL mechanism, leaving them with unhedged risk exposure and ultimately leading to their margin calls.
The reason why market makers fail to fulfill their duties: incentive problems
The simultaneous withdrawal of liquidity reveals a fundamental structural problem. Market makers face multiple possibilities to exit the market:
1. Asymmetric Risk and Return
During periods of extreme market volatility, the potential loss from maintaining quotes far outweighs the spread gains. A market maker offering a quote with $1 million in depth might earn $10,000 in spread gains under normal market conditions, but could face a $500,000 loss in the chain reaction.
2. Information advantage
Market makers have access to aggregate order flow and positions. When they detect a significant bullish bias (87% of positions are long), they already know the direction of the market crash. Why would they even offer buy quotes if they know a sell-off is coming?
3. No legal risk
Unlike traditional exchanges where designated market makers are subject to regulatory obligations, crypto market makers can withdraw freely and face no penalties even during market crises.
4. Arbitrage opportunities
The crash data shows that market makers who withdrew their market-making quotes turned to inter-exchange arbitrage. With price spreads exceeding $300 across different trading platforms, arbitrage profits far outweighed market making.
Market death spiral
The interaction between market maker withdrawals and ADL created a destructive death spiral.
- Initial shock (Trump tariff announcement) triggers sell-off
- Market makers avoid cascading risks
- An order book without orders cannot complete liquidation
- Insurance funds are rapidly depleted by absorbing bad debts
- The ADL mechanism is activated, forcibly closing profitable positions
- Traders who were automatically deleveraged were forced to rebalance their positions, exacerbating selling pressure.
- Trigger more liquidations, return to step 3
This cycle continues until leveraged positions are essentially eliminated. Data shows that open interest across the market fell by about 50% in just a few hours.
The uncomfortable truth about market structure
The market crash of October 10-11 was not primarily due to excessive leverage or a lack of regulation. Its root cause lies in the misaligned incentives within the market structure. Chaos is inevitable when those responsible for maintaining market order gain more from chaos than from stability.
Timeline data shows that market makers didn't panic. They exited simultaneously at the optimal time to minimize their own losses while maximizing opportunities for subsequent trading. This rational behavior under the current incentive structure has led to irrational outcomes for the market as a whole.
Rebuilding trust through accountability
The October 2025 liquidity crisis exposed a fatal flaw in the crypto market: the voluntary liquidity mechanism failed precisely when the market needed it most. The $19 billion in liquidations not only caught over-leveraged traders off guard but also revealed the structural flaws of the market-making system, where liquidity providers enjoy privileges without corresponding responsibility. This crisis was the inevitable result.
The path forward requires recognizing that a purely laissez-faire market mechanism will not work in times of stress. Just as traditional markets have evolved norms like circuit breakers, position limits, and market maker obligations to combat disorderly trading, similar safeguards must be implemented in crypto markets.
The technical solutions are already available:
- A progressive obligation system that links benefits with responsibilities
- The size of insurance funds should match actual risks, not be based on optimistic forecasts.
- ADL mechanism with “circuit breakers” to prevent cascading risks
- Real-time transparency of market maker behavior
What’s missing is the will to implement these measures. As long as crypto exchanges prioritize short-term fee maximization over long-term stability, these so-called “unprecedented” events will continue to occur with sad regularity.
The 1.6 million accounts that were liquidated between October 10th and 11th were the price paid for this structural flaw. The question is whether the industry will learn from this disaster, or wait for the next wave of traders to repeat the same mistakes. When a crisis strikes, the market makers they rely on will disappear in an instant, leaving behind only a chain reaction of liquidations and forced liquidations of profitable positions.