
Author: Chris Beamish, CryptoVizArt, Antoine Colpaert, Glassnode
Compiled by: AididiaoJP, Foresight News
Bitcoin's struggle below key cost levels reflects weakening demand and continued selling by long-term holders. While volatility has subsided and options positioning is relatively balanced, the market is now hinged on expectations surrounding the Federal Reserve meeting, and any hawkish surprise could reignite volatility.
summary
- Bitcoin rebounded over the weekend from a supply cluster of $107,000 to $118,000, mimicking a brief rally after previously hitting an all-time high, but continued selling pressure from long-term holders limited further gains.
- The market continues to struggle above the short-term holders' cost base (approximately $113,000), a key battleground between bullish and bearish momentum. Failure to reclaim this level increases the risk of a deeper price retracement to realize gains among active investors (approximately $88,000).
- Short-term holders are exiting at a loss, while long-term holders remain the main force of heavy selling pressure (approximately -104,000 BTC/month), indicating that confidence is waning and supply is being absorbed continuously.
- Implied volatility has cooled sharply after the plunge in October, with skewness leveling off, and option flows reflect controlled upside potential and restrained downside hedging.
- The current calm in volatility hinges on the Fed's next decision. A dovish outcome would likely keep prices stable, but any hawkish surprise could reignite volatility and demand for downside protection.
On-chain insights
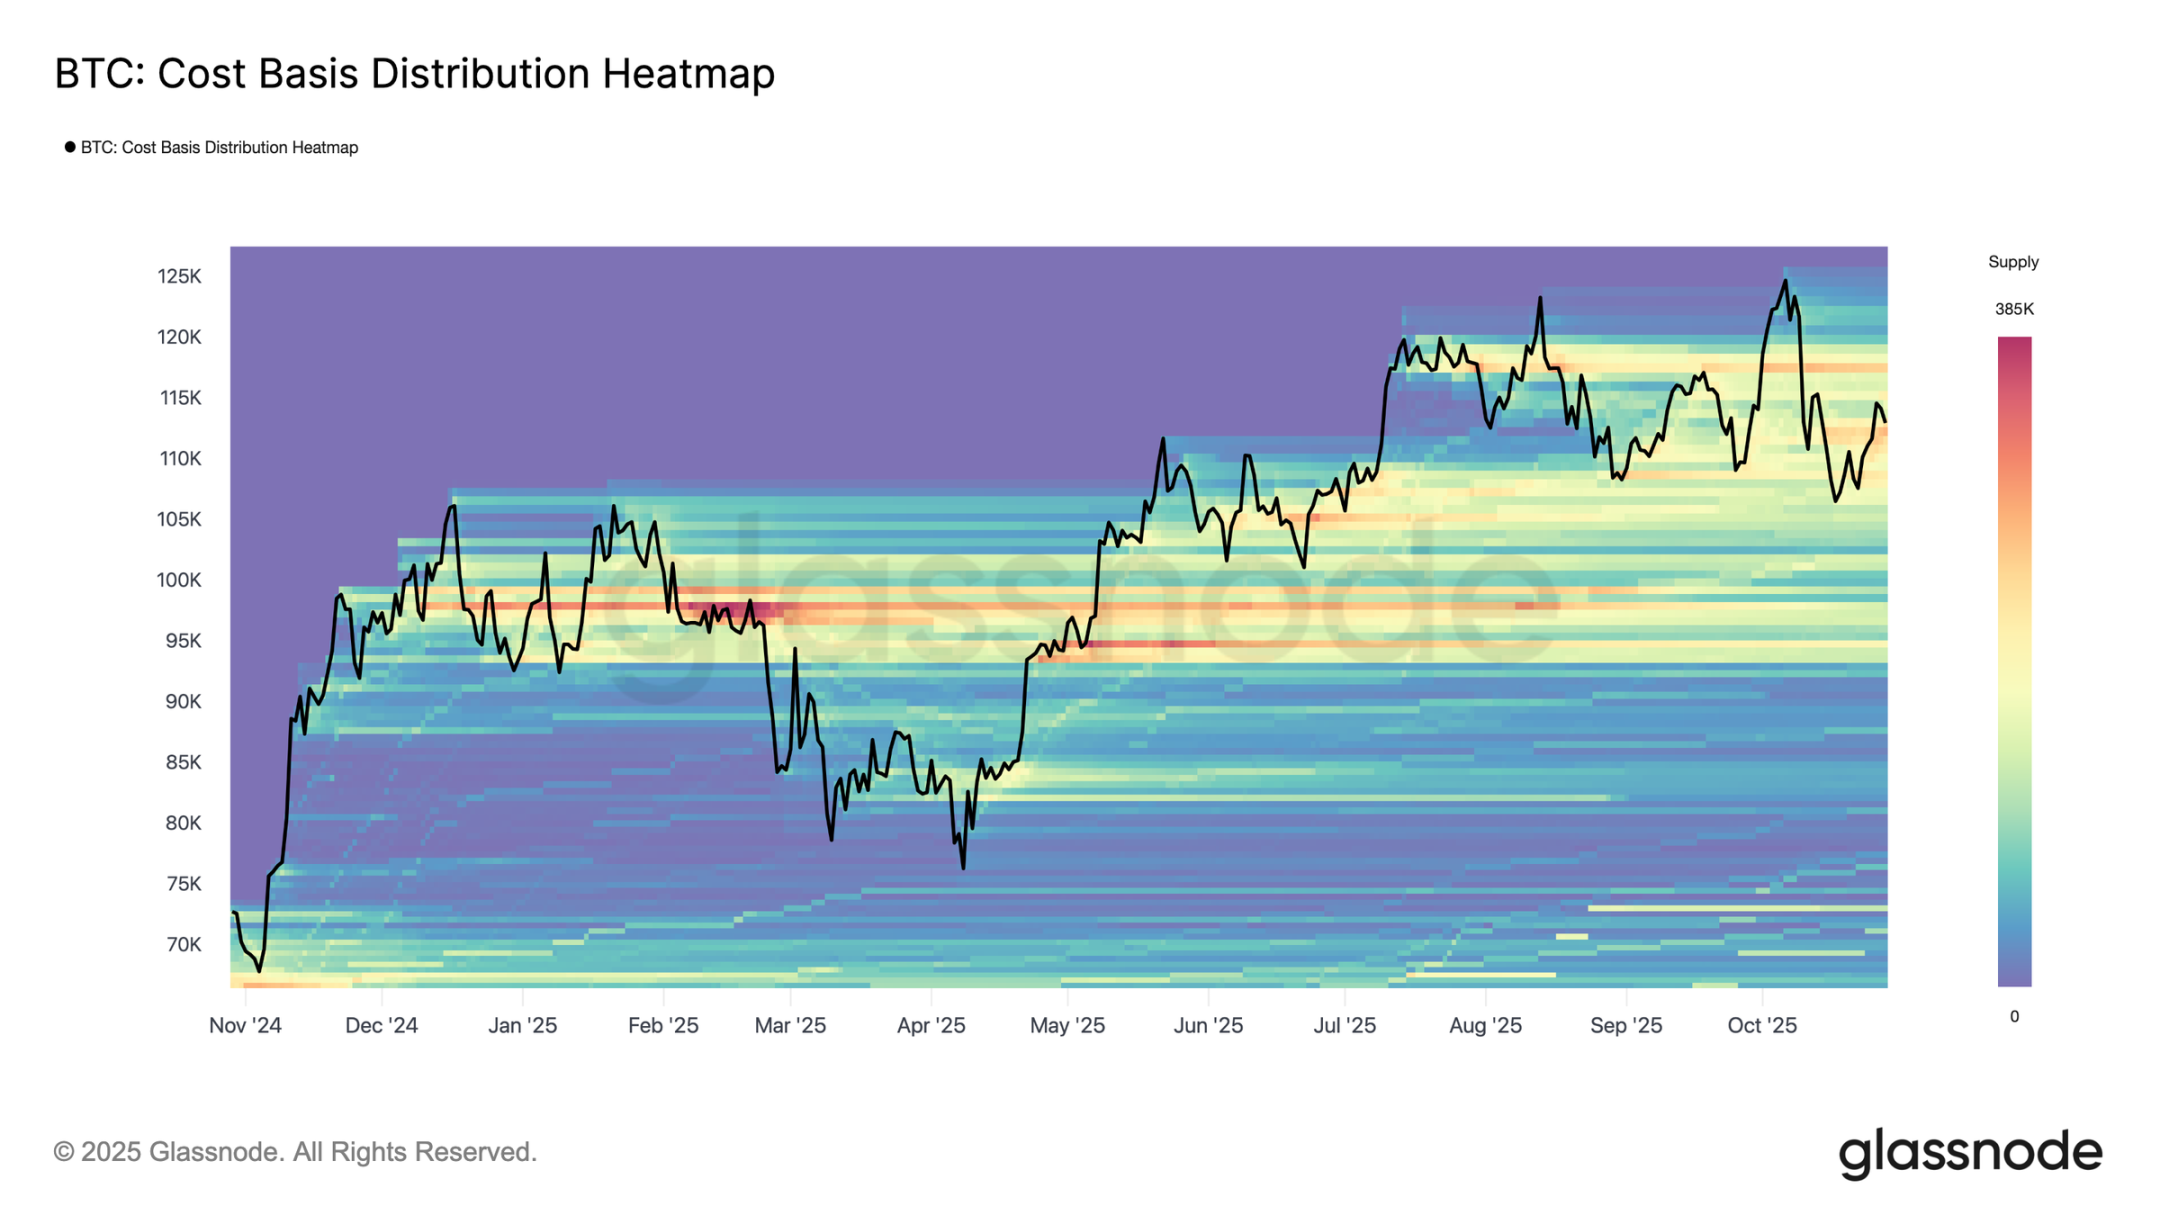
Familiar rebound pattern
Bitcoin staged a brief recovery over the weekend after briefly dipping to the lower bound of the top buyer supply cluster ($107,000 to $118,000). According to the cost base distribution heatmap, the price rebounded from near the midline of $116,000 before falling back to around $113,000.
This structure closely mirrors the rebound pattern observed after all-time highs in the second and third quarters of 2024 and the first quarter of 2025, characterized by temporary rallies followed by demand quickly being absorbed by supply above. In the current context, a new wave of selling by long-term holders further amplifies the resistance at this supply level, highlighting how profit-taking at higher levels continues to limit upward momentum.
Struggling to hold the line
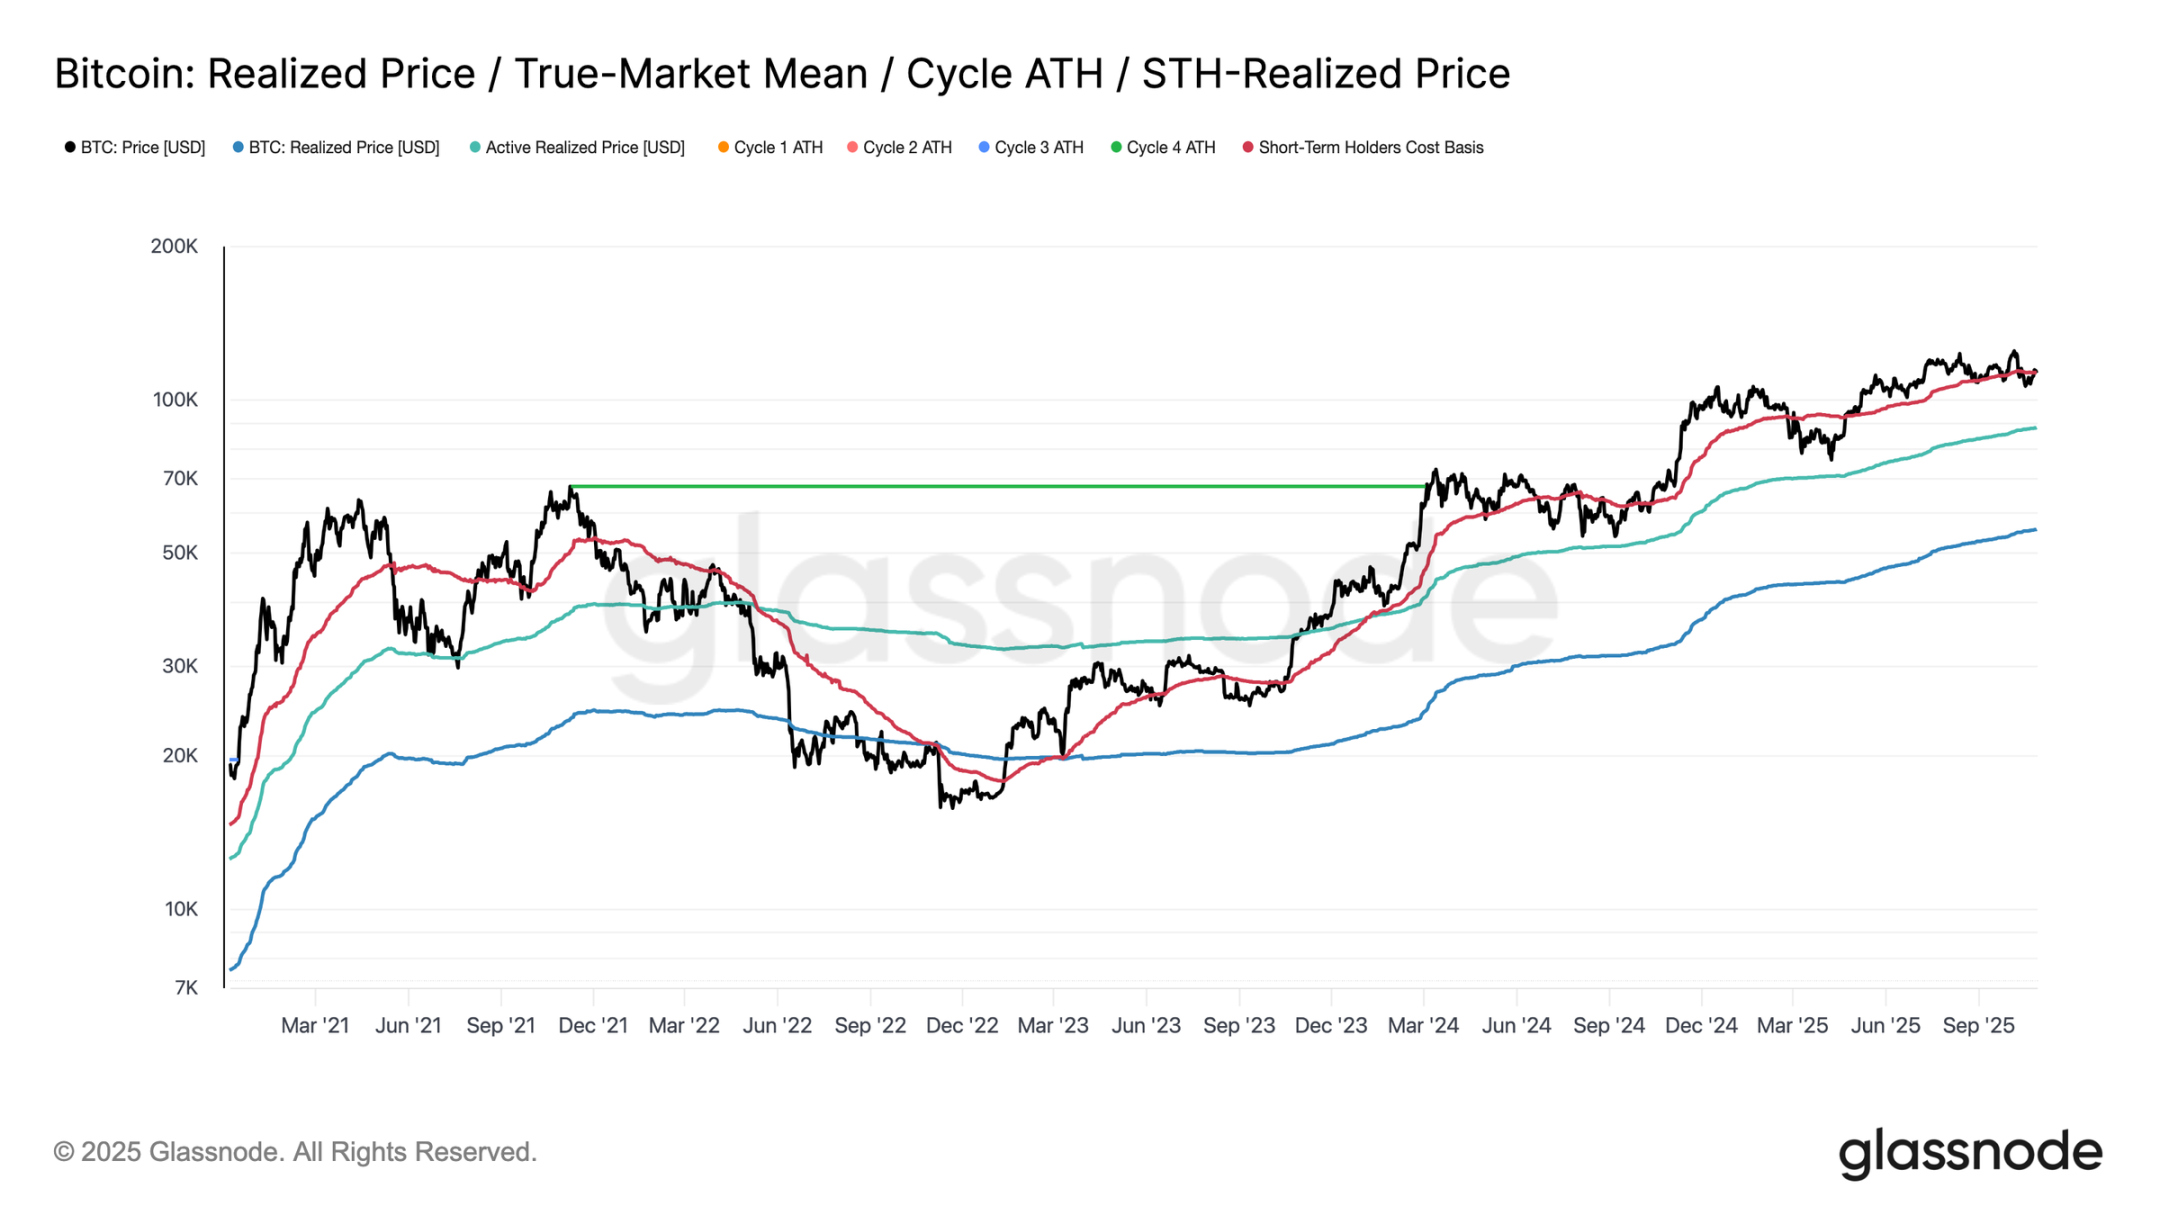
Following the weekend rally, Bitcoin briefly recovered the $113,000 level near the cost basis for short-term holders, a level typically considered a dividing line between bullish and bearish momentum. Holding this threshold usually indicates strong enough demand to absorb sustained selling pressure. However, the failure to hold above this level, especially after trading higher for six consecutive months, suggests weakening demand.
Over the past two weeks, Bitcoin has struggled to close a weekly candle above this key level, increasing the risk of further weakness. If this phase continues, the next significant support level is around $88,000, where active investors realize a price level that reflects the cost basis of active circulating supply and has typically signaled deeper correction phases in previous cycles.
Short-term holder pressure
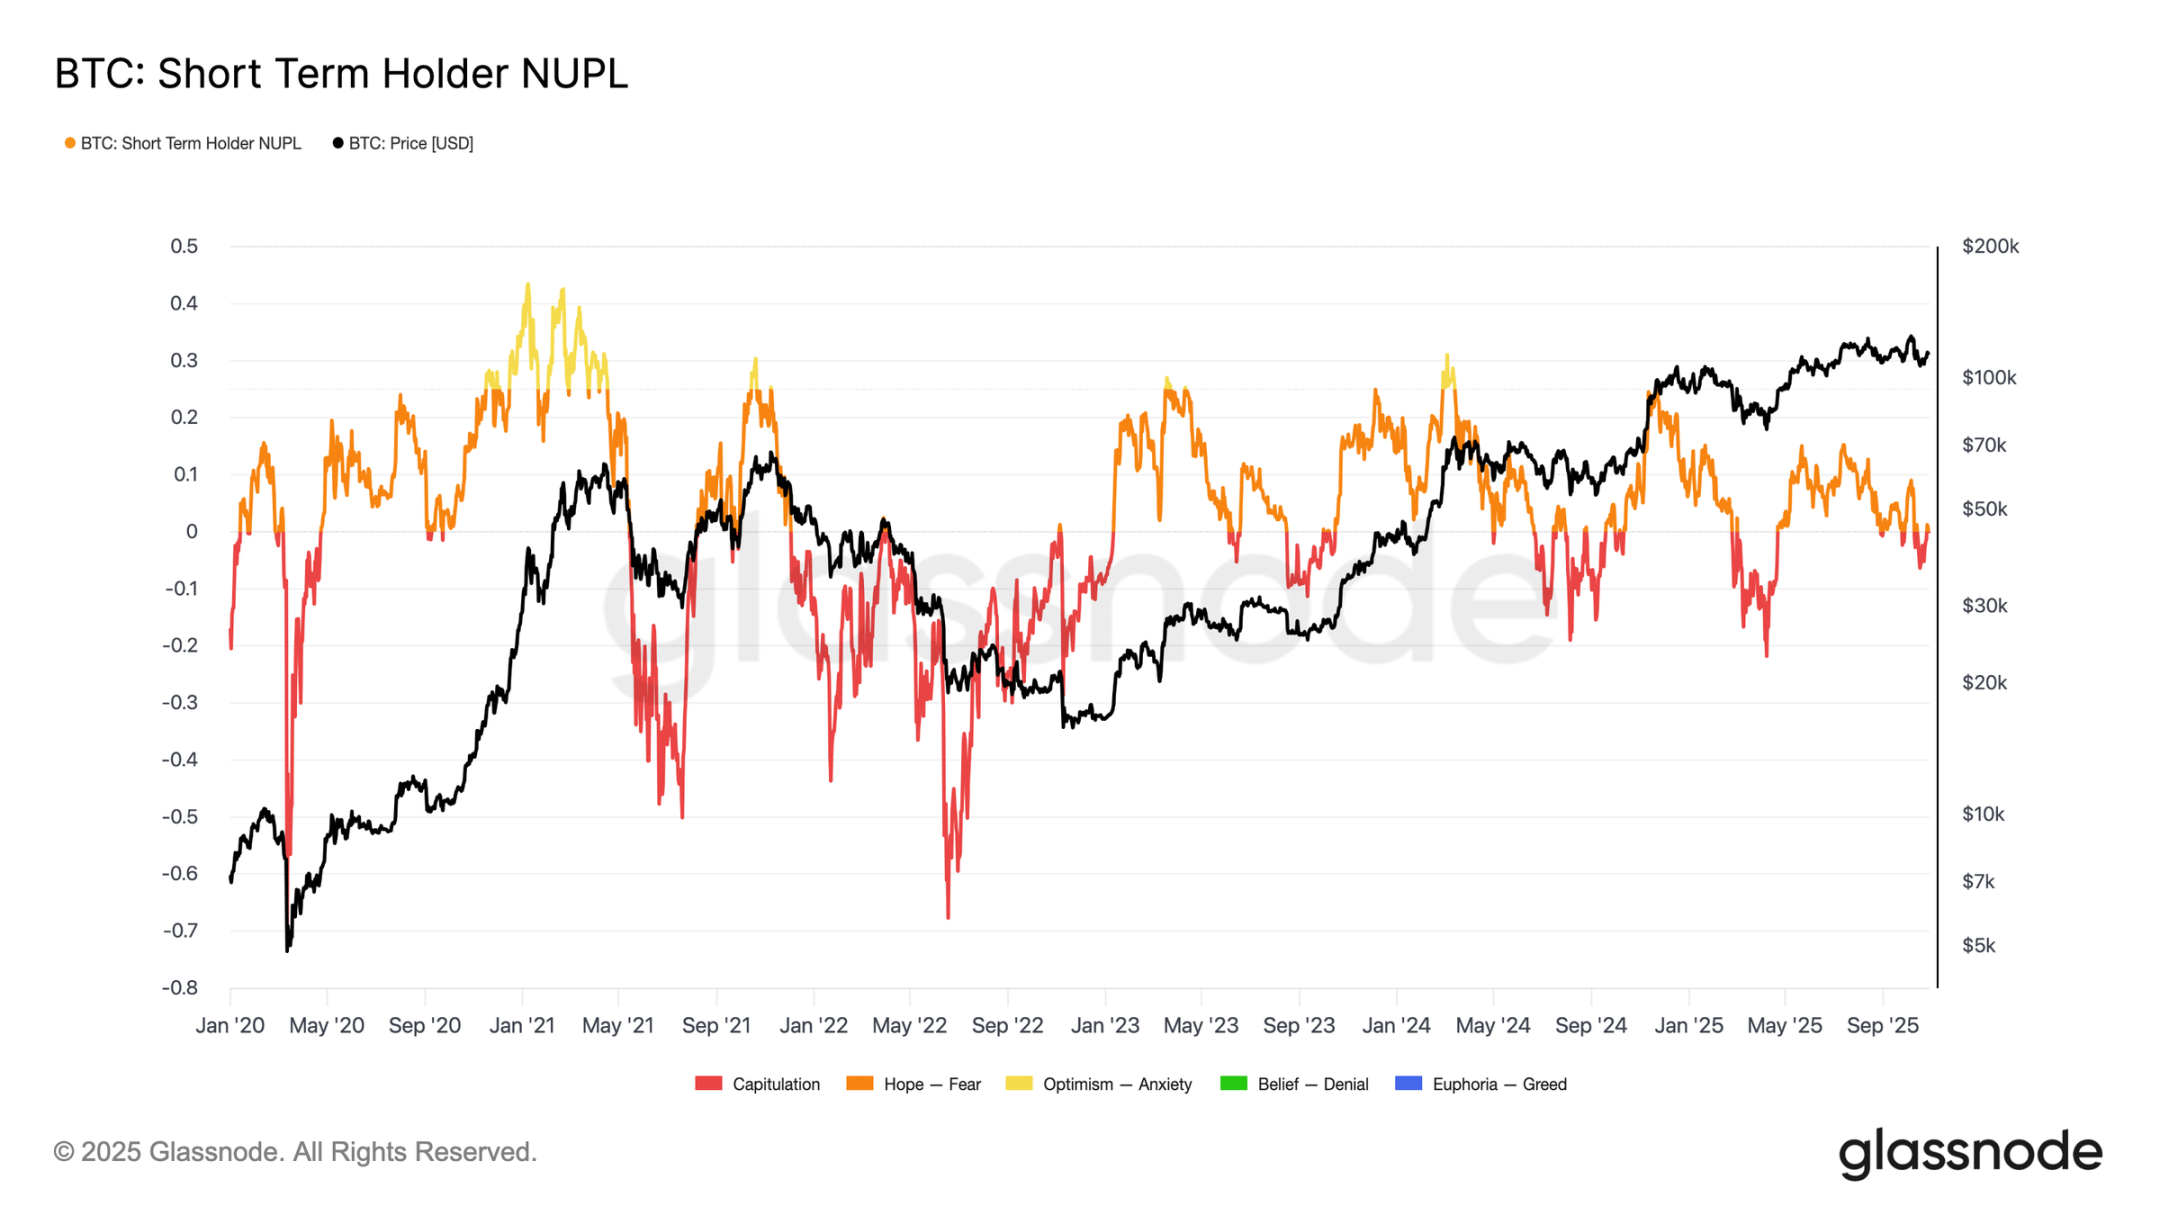
Extending the analysis to investor sentiment, further market weakness is likely to be driven by short-term holders, who are now top buyers exiting at a loss. The short-term holder net unrealized profit/loss metric helps assess this pressure by measuring the ratio of unrealized profits or losses to market capitalization.
Historically, deep negative values have coincided with the capitulation phase before a market bottom is formed. The recent drop to $107,000 pushed short-term holders' net unrealized profit/loss to -0.05, a slight loss compared to the -0.1 to -0.2 range during a typical mid-term bull market correction, or below -0.2 at the bottom of a deep bear market.
As long as Bitcoin trades within the top buyer cluster between $107,000 and $117,000, the market is in a delicate balance and has not yet completely surrendered, but as confidence continues to erode, it is gradually turning against the bulls.
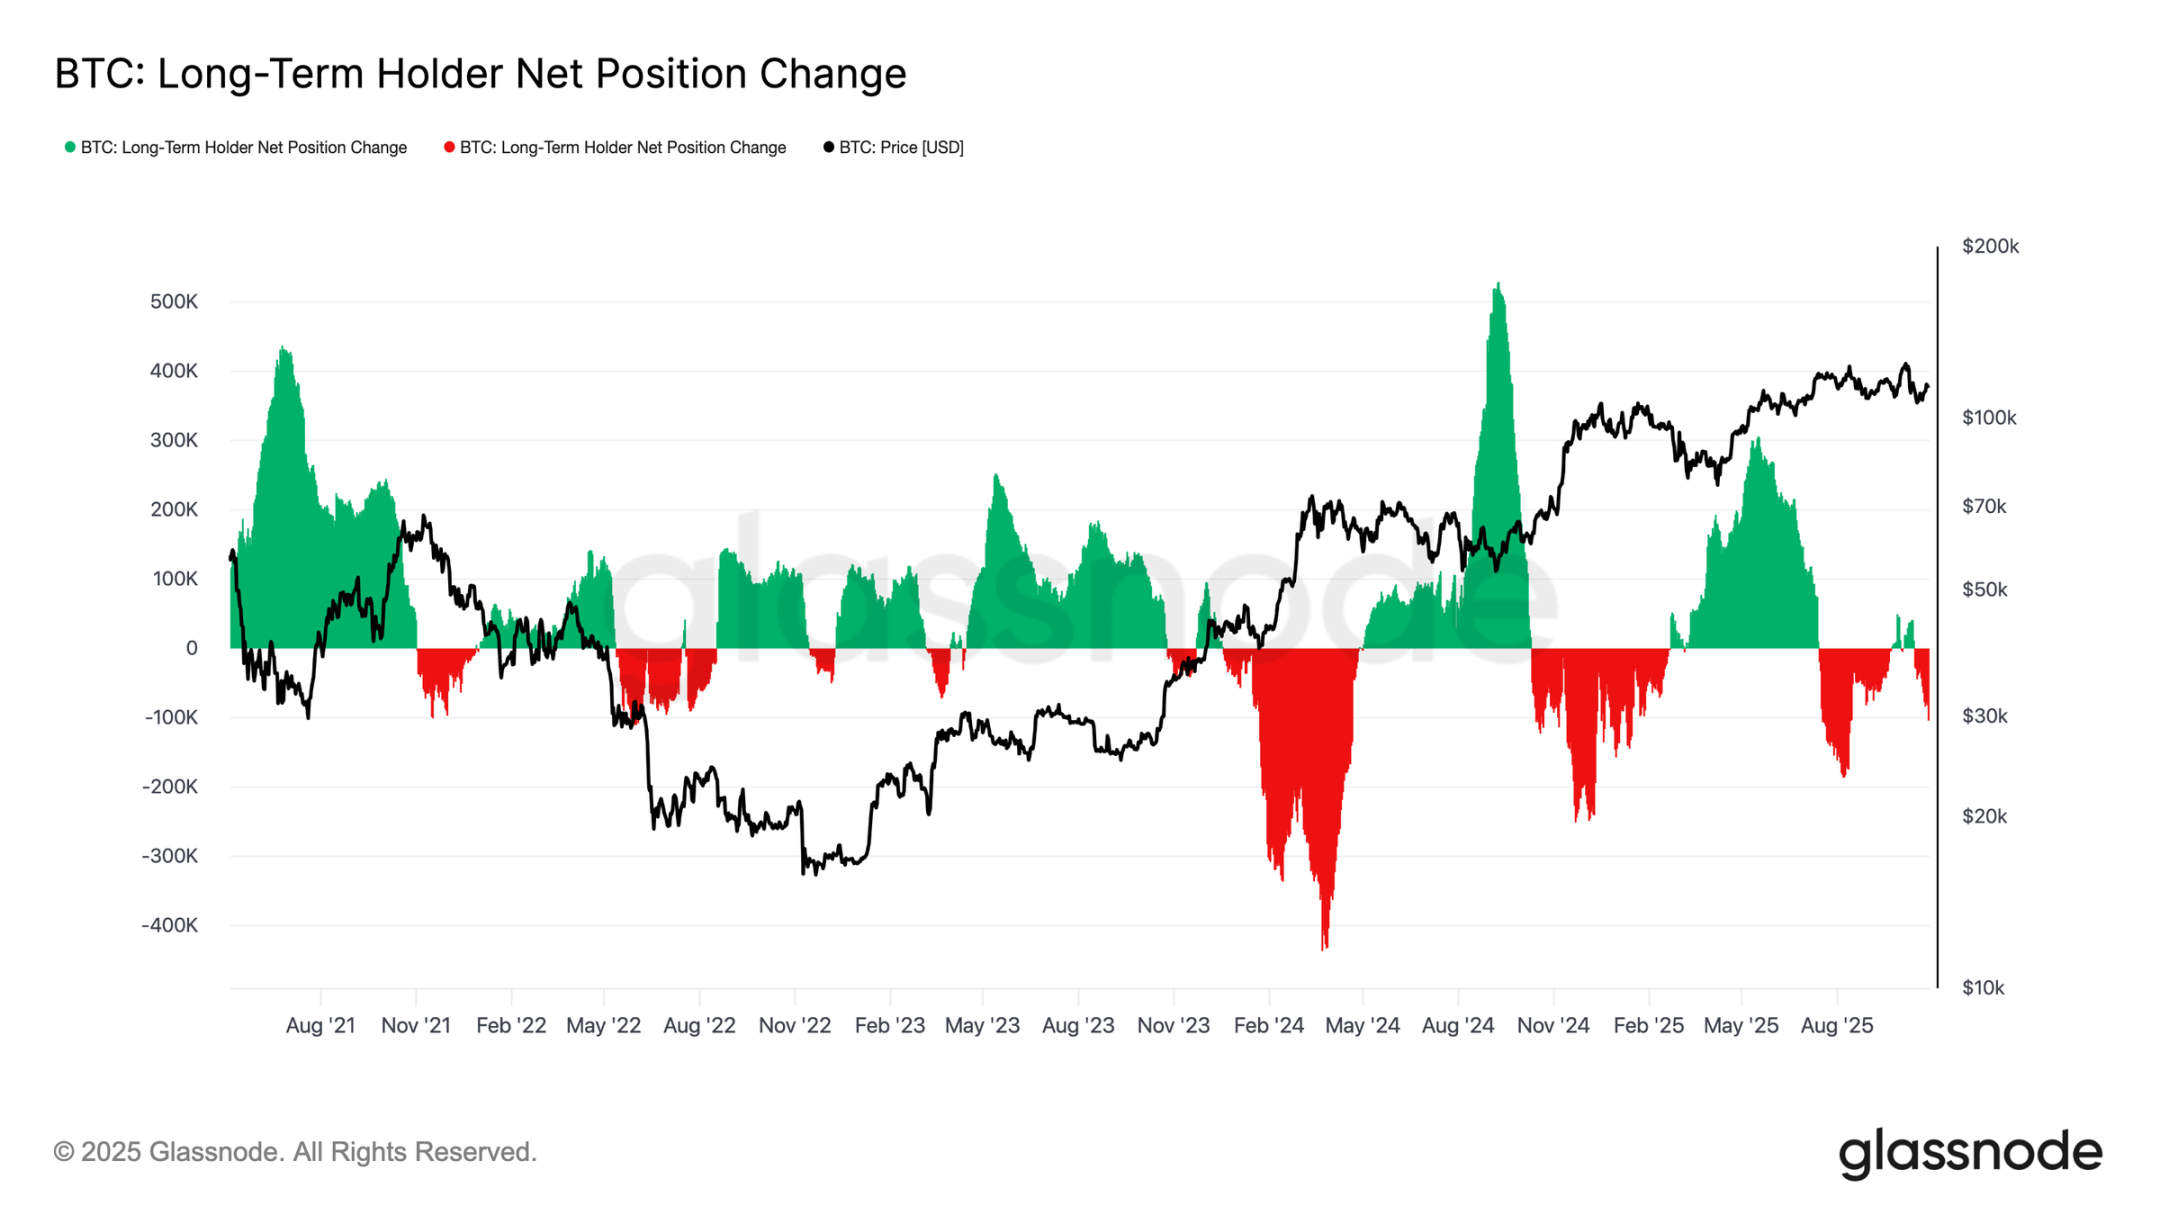
Long-term holders sell
Based on previous observations, continued selling by long-term holders continues to weigh on market structure. The net change in long-term holder positions has fallen to -104,000 BTC per month, highlighting the most significant wave of selling since mid-July.
This persistent selling pressure is consistent with broader signs of exhaustion seen in the market, as experienced investors continue to take profits amid weakening demand.
Historically, major market expansions have only begun after long-term holders shift from net selling to sustained accumulation. Therefore, a return to net positive inflows from this group remains a crucial prerequisite for restoring market resilience and laying the foundation for the next bull market phase. Until this shift occurs, selling by long-term investors is likely to continue to weigh on price action.
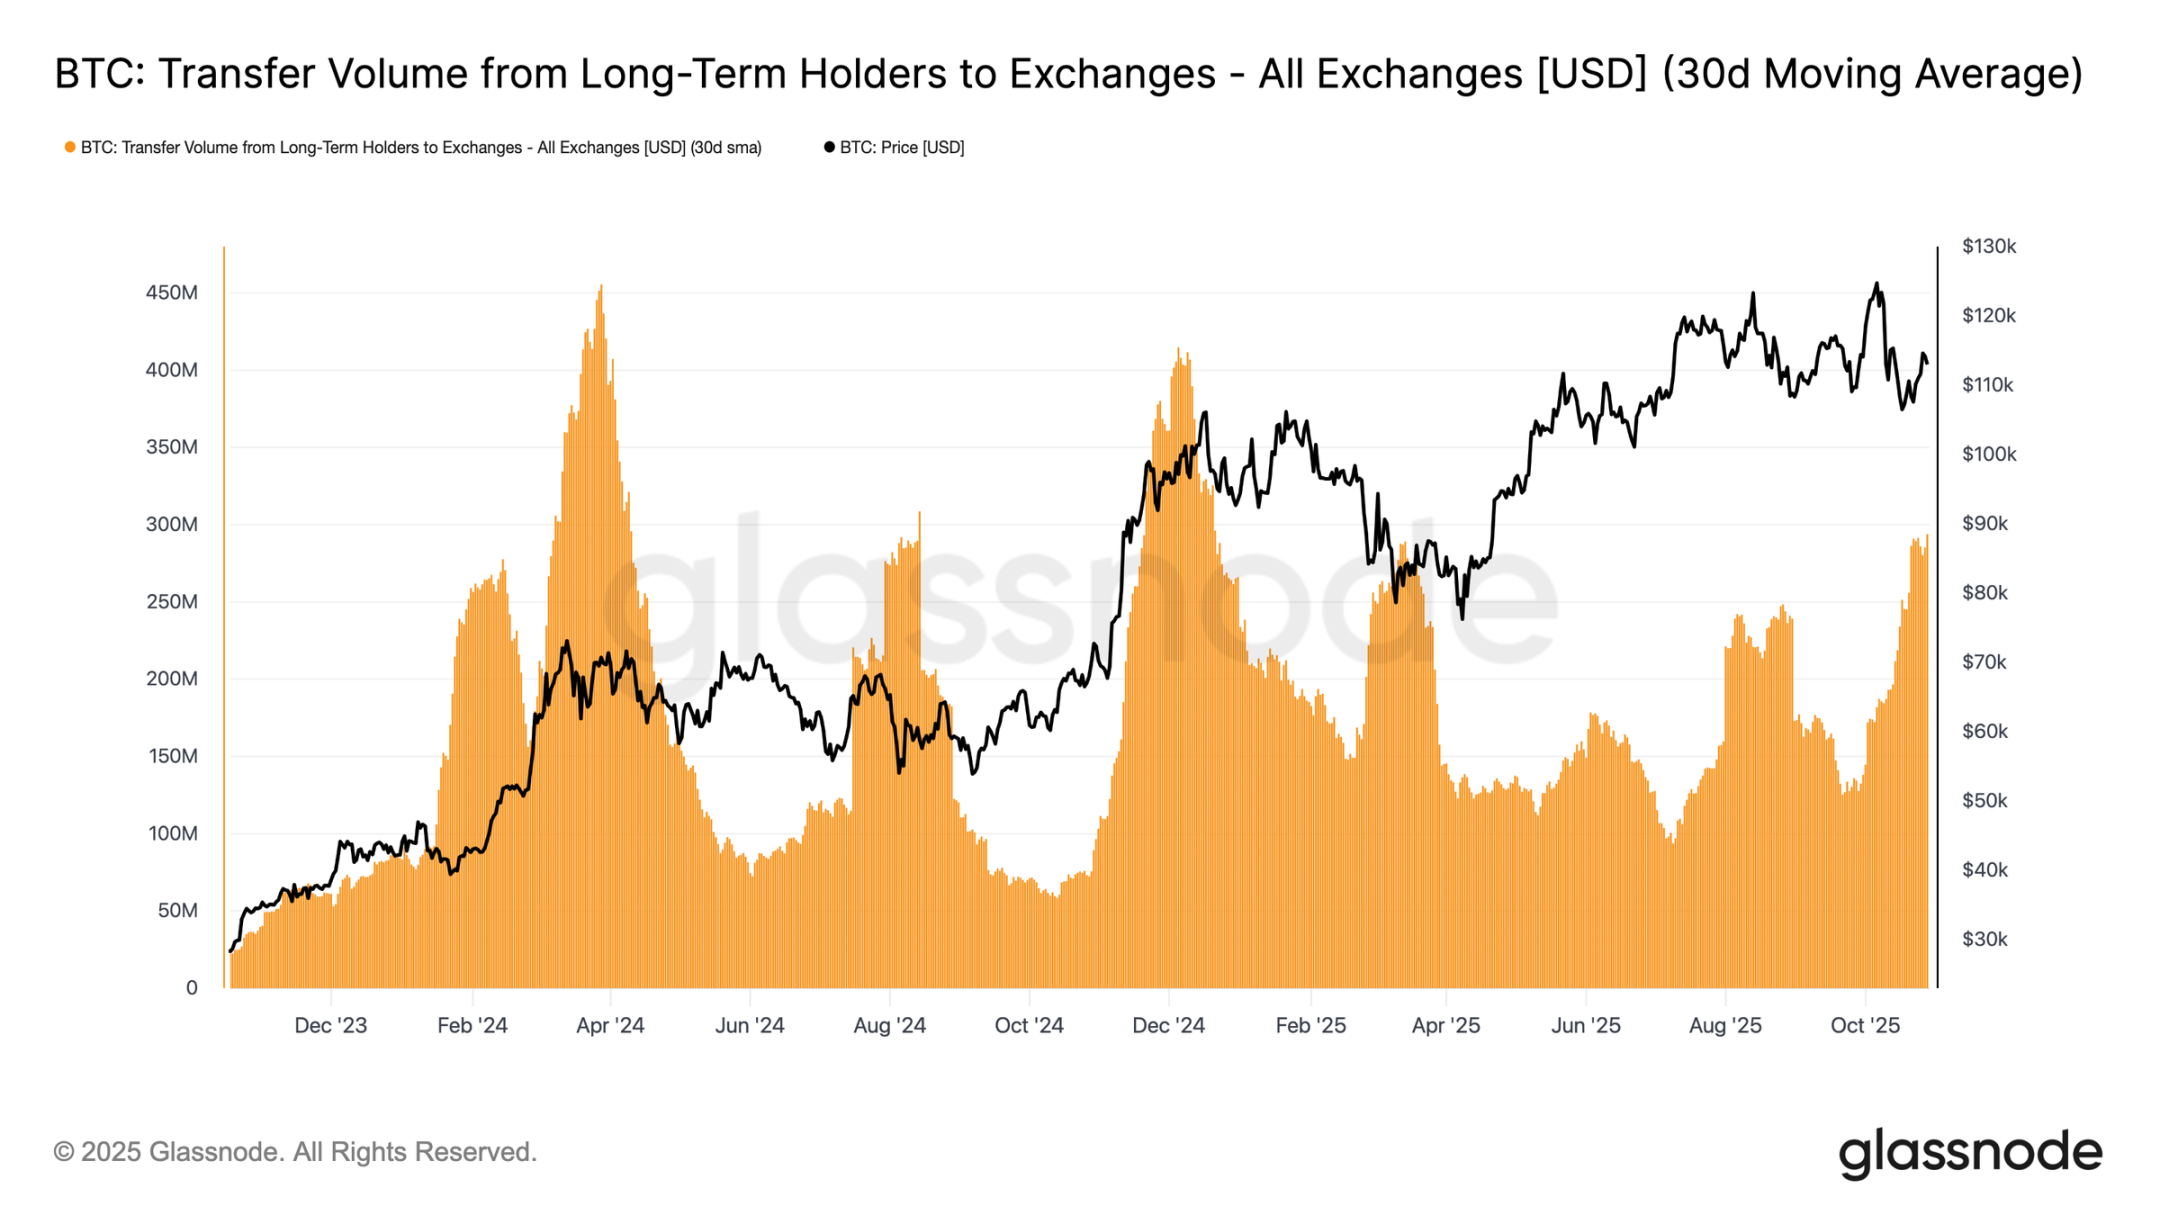
To gauge the intensity of selling by long-term holders, we can turn to the volume of tokens transferred to exchanges by long-term holders (30-day simple moving average), a metric that captures the value of tokens transferred by experienced investors in anticipation of a potential sale. This metric has surged to approximately $293 million per day, more than double the benchmark level of $100 million to $125 million that has been prevalent since November 2024.
Such high transfer activity indicates that long-term investors are continuing to realize profits, increasing sustained selling pressure. The current pattern is very similar to that of August 2024, a period characterized by active spending by long-term holders while price momentum was slowing. Unless this transfer flow subsides, spot demand will struggle to absorb the continued sell-off, making the market susceptible to further cooling in the coming weeks.
Off-chain insights
Options market cools down
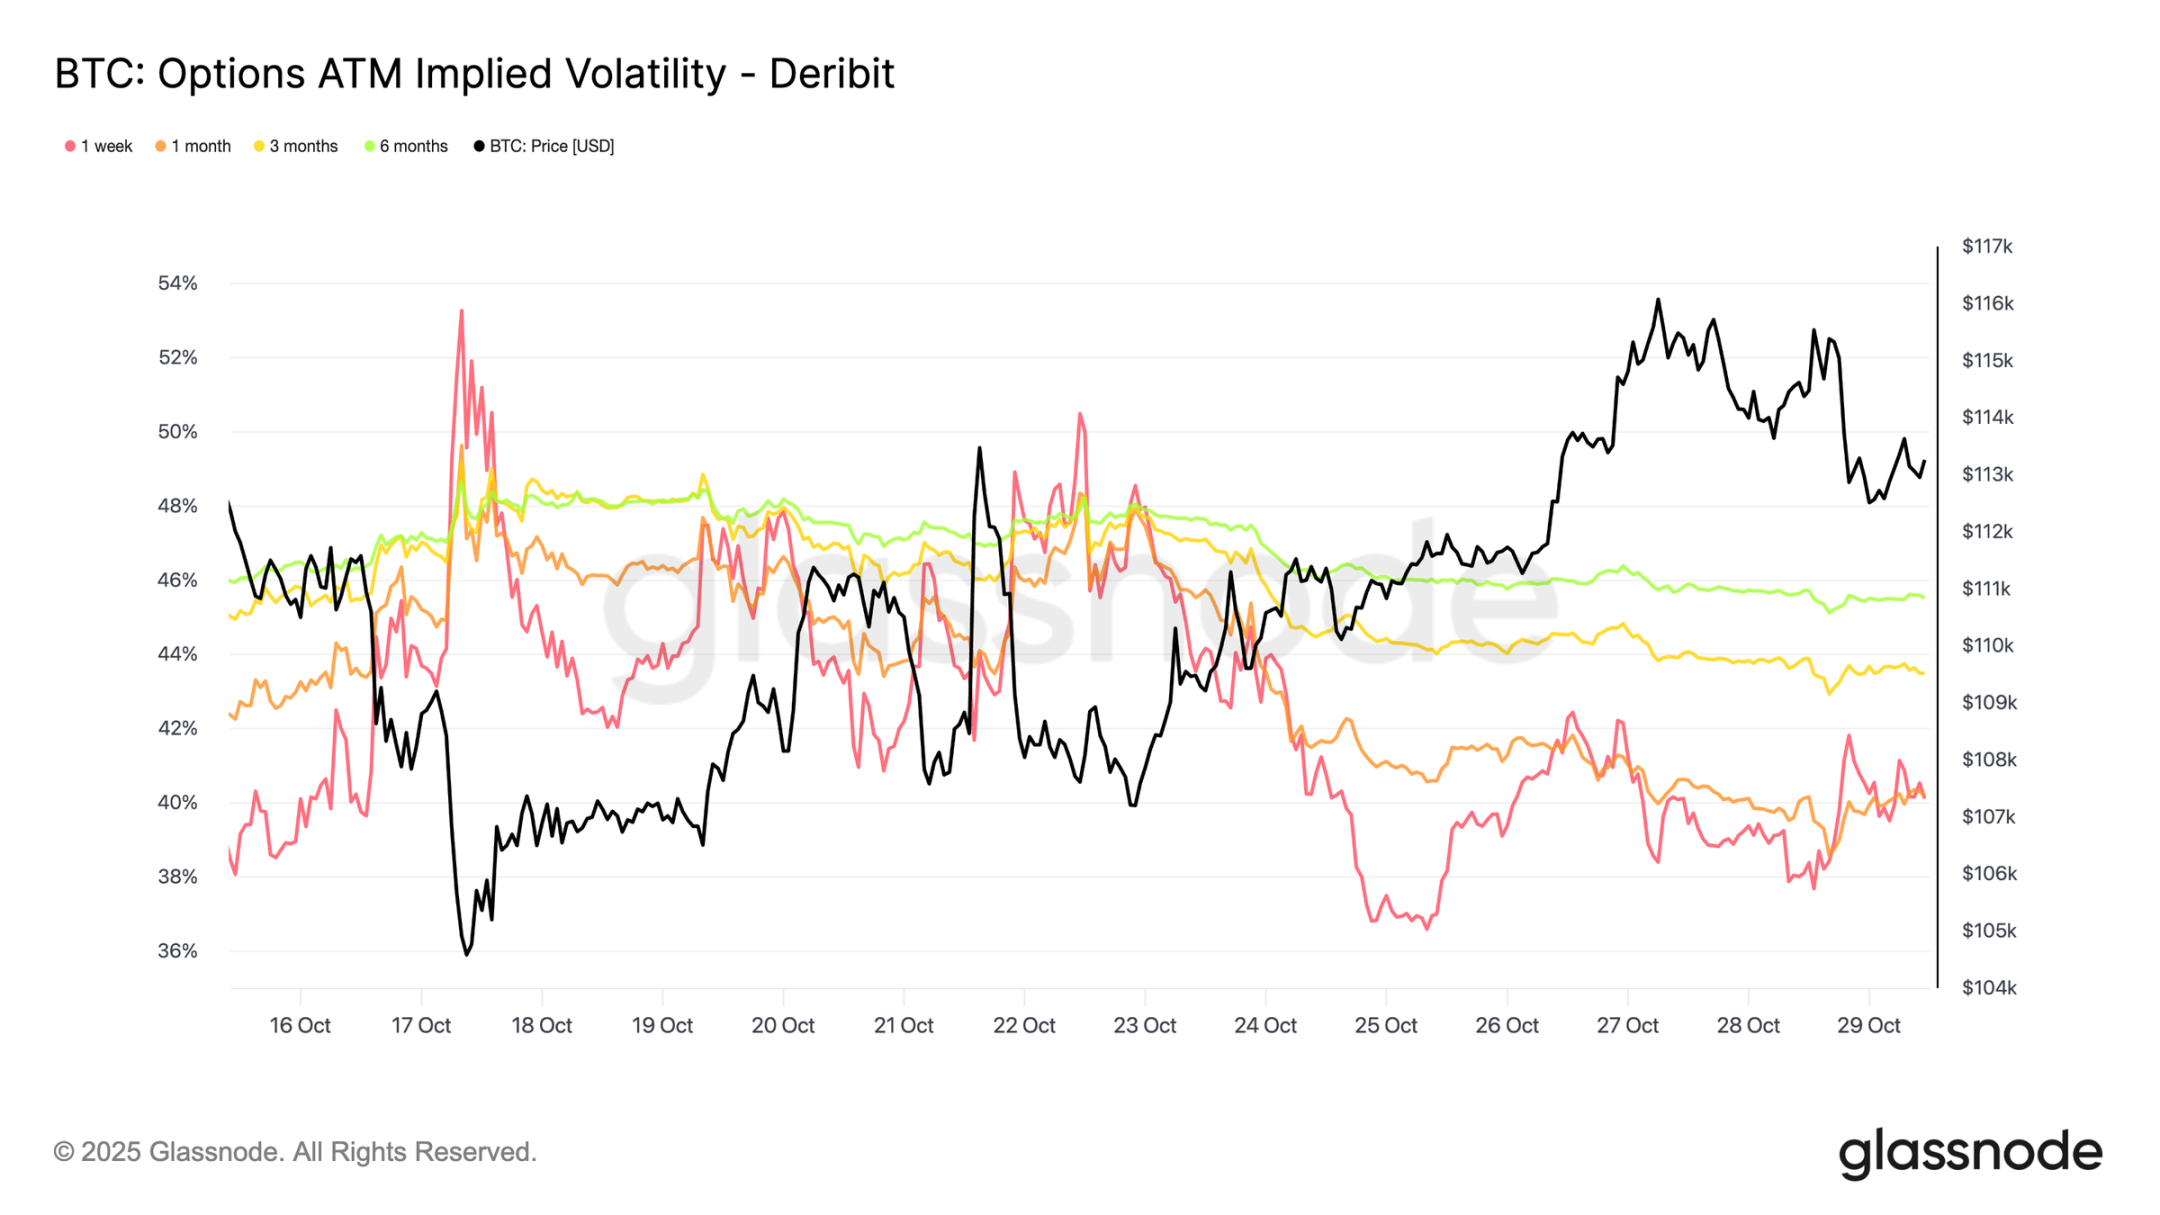
Turning to the options market, recent data shows that volatility pressures following the October 10th crash continue to ease. Bitcoin's 30-day realized volatility has fallen to 42.6%, slightly lower than last week's 44%, reflecting a calmer price action. Meanwhile, implied volatility, representing traders' expectations, has declined more sharply as participants unwind downside hedging and reduce their need for protection.
Shorter-term contracts saw the largest adjustments, with 1-week at-the-money implied volatility falling by more than 10 volatility points to approximately 40%, while contracts with maturities of 1 to 6 months only declined by 1-2 points, remaining around the mid-40% level. This flattening of the term structure suggests that traders expect a reduction in near-term shocks.
The curve also suggests that volatility is expected to climb slowly to around 45% in the coming months, rather than experiencing a sudden surge.
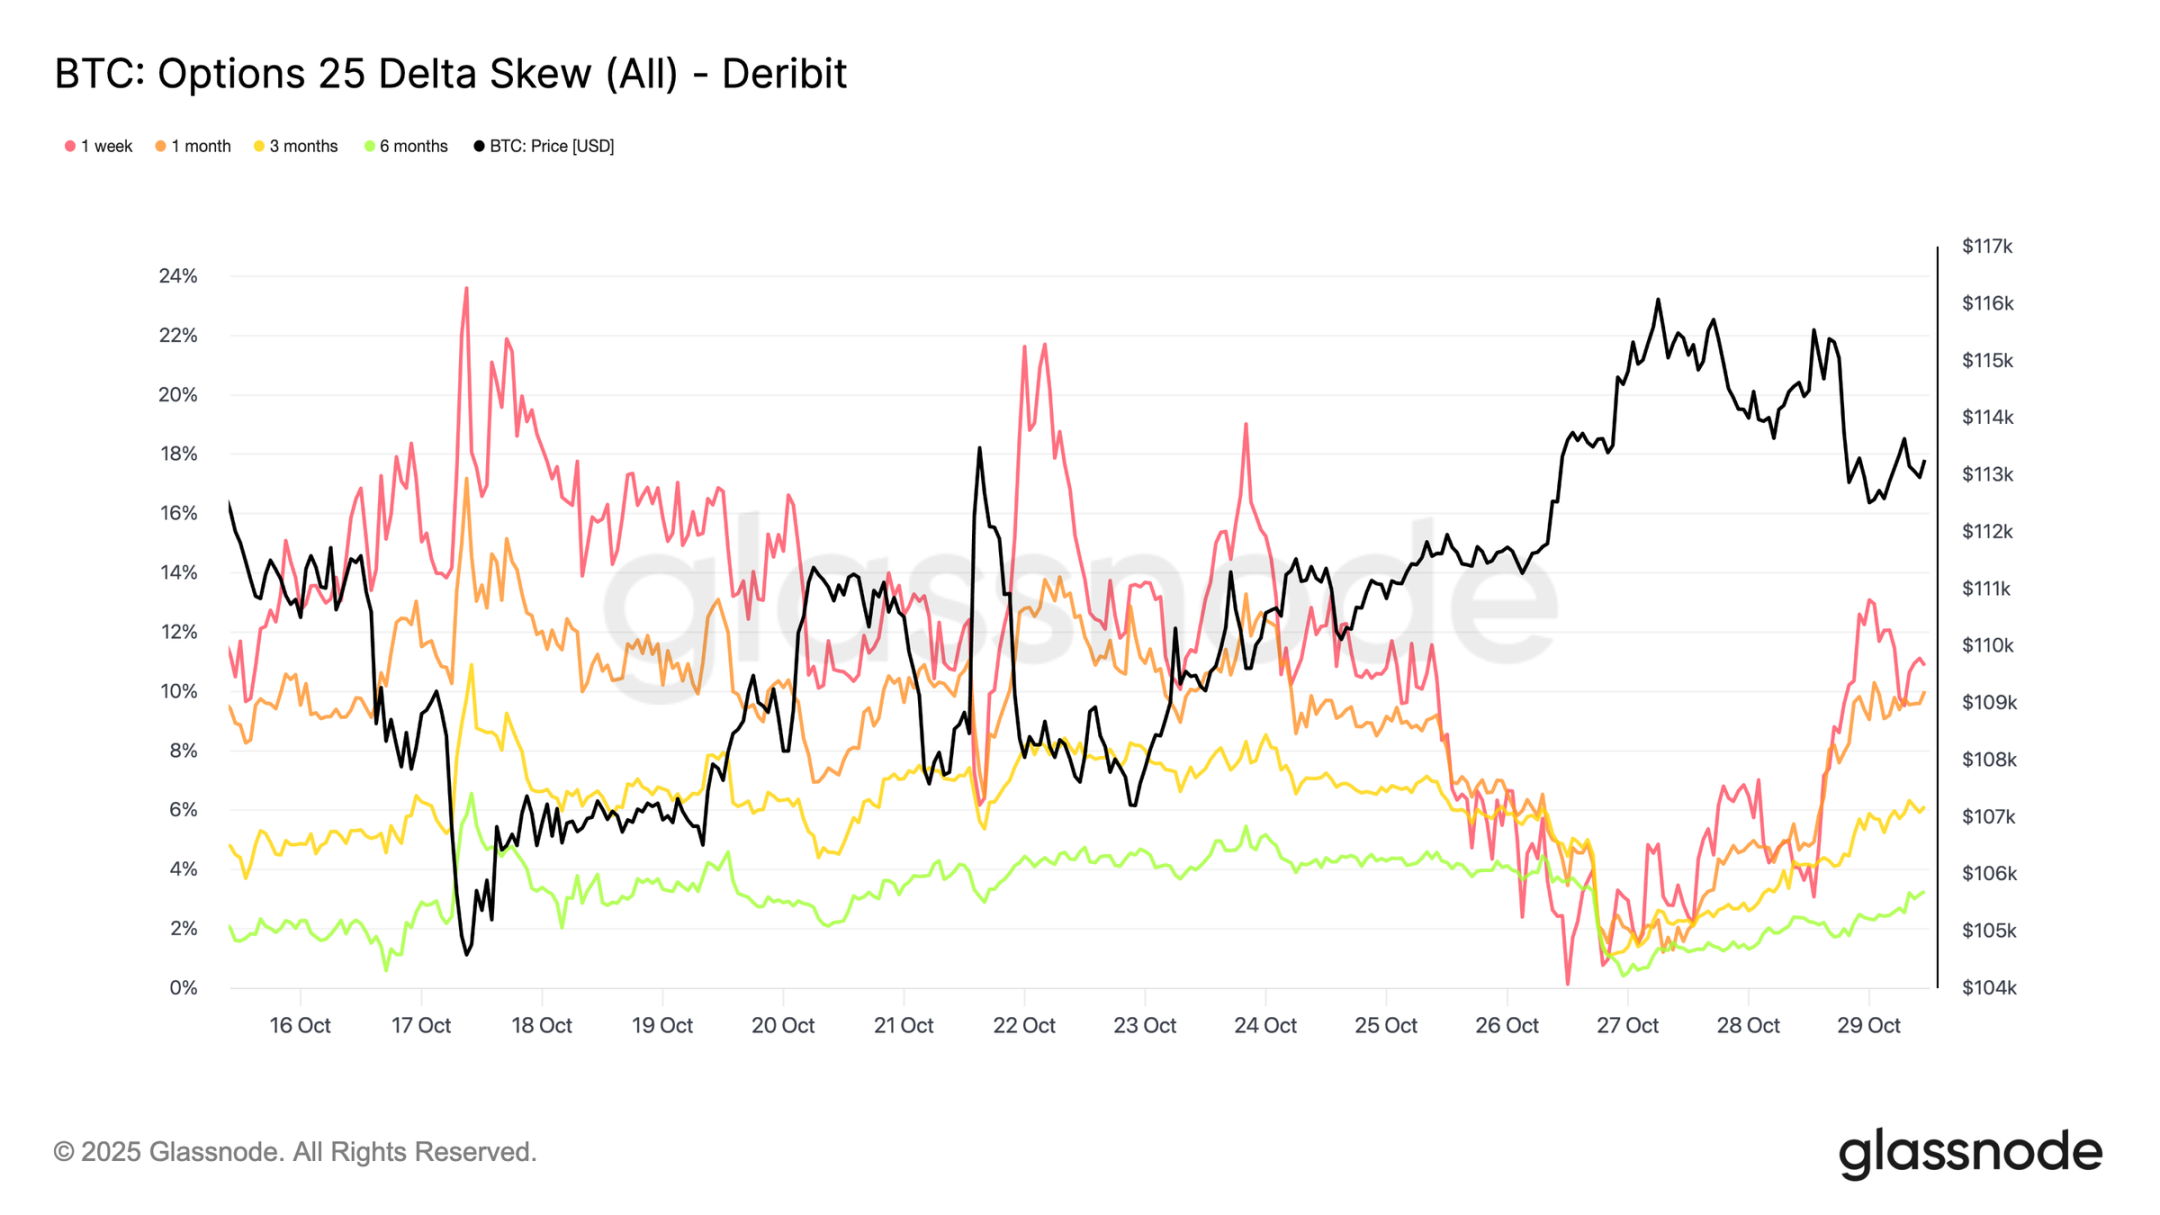
Skewness reset decreases
The easing of implied volatility also translated into a significant shift in 25-Delta skewness, a metric that measures the relative cost of put options versus call options. Positive skewness indicates a premium in put option trading. Following the October cleansing, 1-week skewness surged to over 20%, indicating extremely strong demand for downside protection. Since then, it has collapsed to neutral levels, with slight but much weaker rebounds.
Longer-term contracts, such as 1-month and 3-month terms, have also reset sharply, showing only modest put option premiums. This shift suggests that traders have removed most of their downside hedging. Positions are now closer to "mildly bullish/two-way" rather than "panic lows," consistent with the broader stability seen in Bitcoin's recent price action.
Selective bullish positions
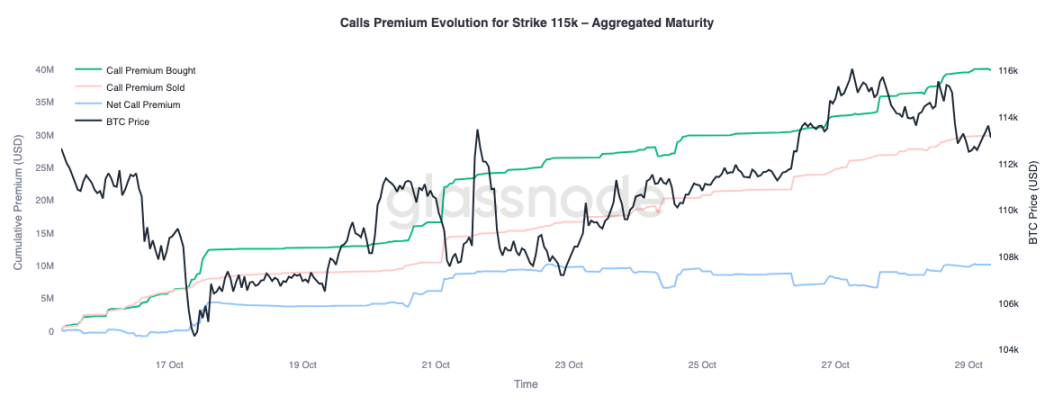
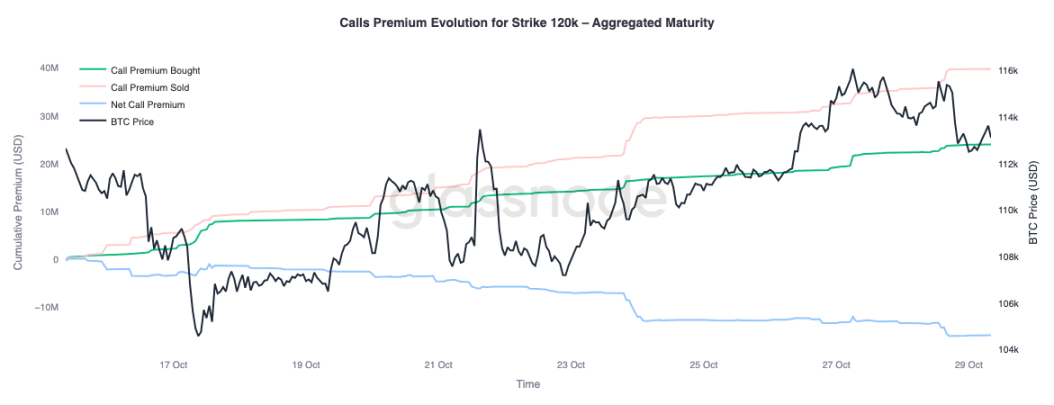
With skewness normalizing, attention has turned to where traders are channeling their premiums. Call option activity now varies significantly depending on the strike price. At a strike price of $115,000, net premiums paid for buying call options remain positive, indicating that traders are continuing to pay for near-term upside as prices have recovered over the past two weeks. In contrast, at a strike price of $120,000, premiums paid for selling call options exceeded those paid for, resulting in a negative net premium.
This setup reflects a "mild rally, not a full-blown breakout" stance. Traders are willing to pay for gains closer to the spot price, but finance these positions by selling call options with higher strike prices. The resulting call spread structure suggests a cautiously optimistic view, seeking to participate in further upside, but lacking confidence in a full retest of all-time highs.
Market pricing pullback under control
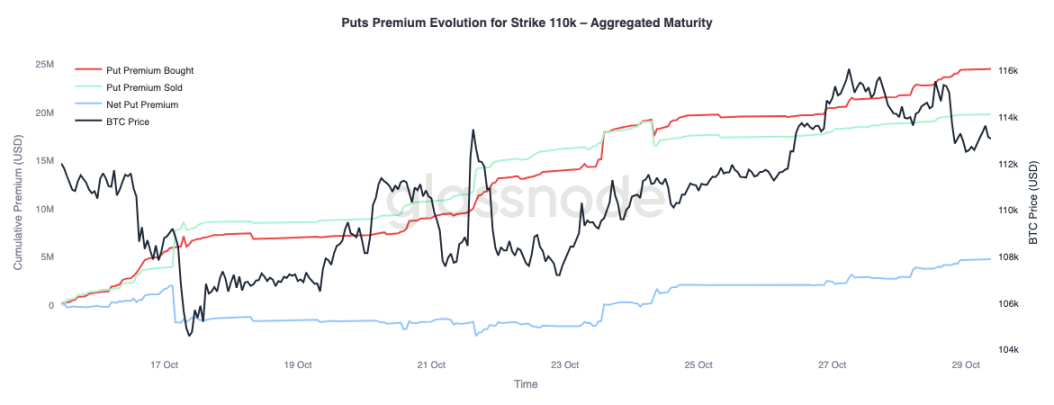
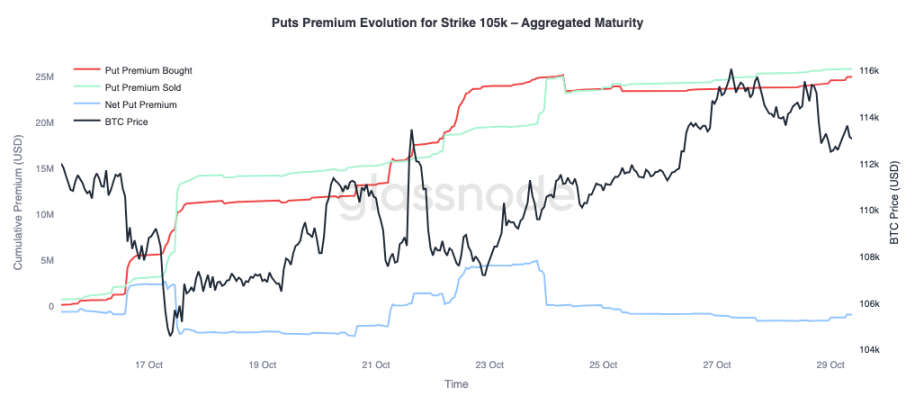
To get a better picture, we can turn to the market's put options. Since October 24, as Bitcoin has surged, traders have been buying $110,000 put options, indicating a need for near-term downside protection. Meanwhile, $105,000 put options have been sold more aggressively, suggesting participants are happy to collect premiums by providing insurance at that deeper strike price.
This contrast highlights a market anticipating a shallow pullback rather than another major wave of liquidation. Traders seem to view consolidation around current levels as possible (with a $110,000 hedge), but see a lower probability of a full break below $105,000. Overall positioning supports the view that the worst of the deleveraging in October is over, and the market is now focused on range trading and volatility harvesting rather than defensive hedging against another sharp sell-off.
in conclusion
The on-chain landscape continues to reflect a market undergoing correction and recalibration. Bitcoin's failure to hold above the cost basis for short-term holders highlights waning momentum and persistent selling pressure from both short- and long-term investors. Increased selling by long-term holders and high transfer volumes to exchanges underscore a phase of waning demand, suggesting the market may need to consolidate for an extended period to rebuild confidence. The upward recovery is likely to remain limited until long-term holders return to accumulation mode.
Turning to the options market, implied volatility has declined sharply, skewness has normalized, and options flows now reflect controlled upside exposure and restrained downside hedging. Structurally, the crypto options market appears to be transitioning from crisis mode to rebuilding mode, indicating improved stability.
However, the next major catalyst is looming: the Federal Reserve meeting. Rate cuts are already largely priced in, meaning a dovish outcome is likely to keep volatility subdued and skewed. Conversely, if the Fed offers a smaller rate cut or maintains a hawkish tone, short-term implied volatility could rise again, and the 25-Delta skew could widen as traders rush to repurchase protection. In essence, the current market calm is conditional; it is stable at present but fragile should the Fed deviate from expectations.
