
By Michael Nadeau
Compiled by Luffy, Foresight News
Tom Lee proposed at the recent Korea Blockchain Week that Ethereum's medium-term target price is $60,000, and said that Ethereum is in a super cycle lasting 10-15 years.
If his judgment is correct, this super cycle will advance in waves, spanning multiple cycles, with alternating bull and bear markets.
We are currently in a bull market, but it won’t last forever.
Looking back at history, Ethereum fell by 94% in 2018 and 80% in 2022. Therefore, we have reason to predict that there will still be a sharp correction in the future.
We cannot currently determine when a pullback will occur, but by tracking a number of key indicators, we can reference the levels Ethereum has reached in past cycles to provide a basis for future trends.
Key indicator analysis and price targets
200-week moving average
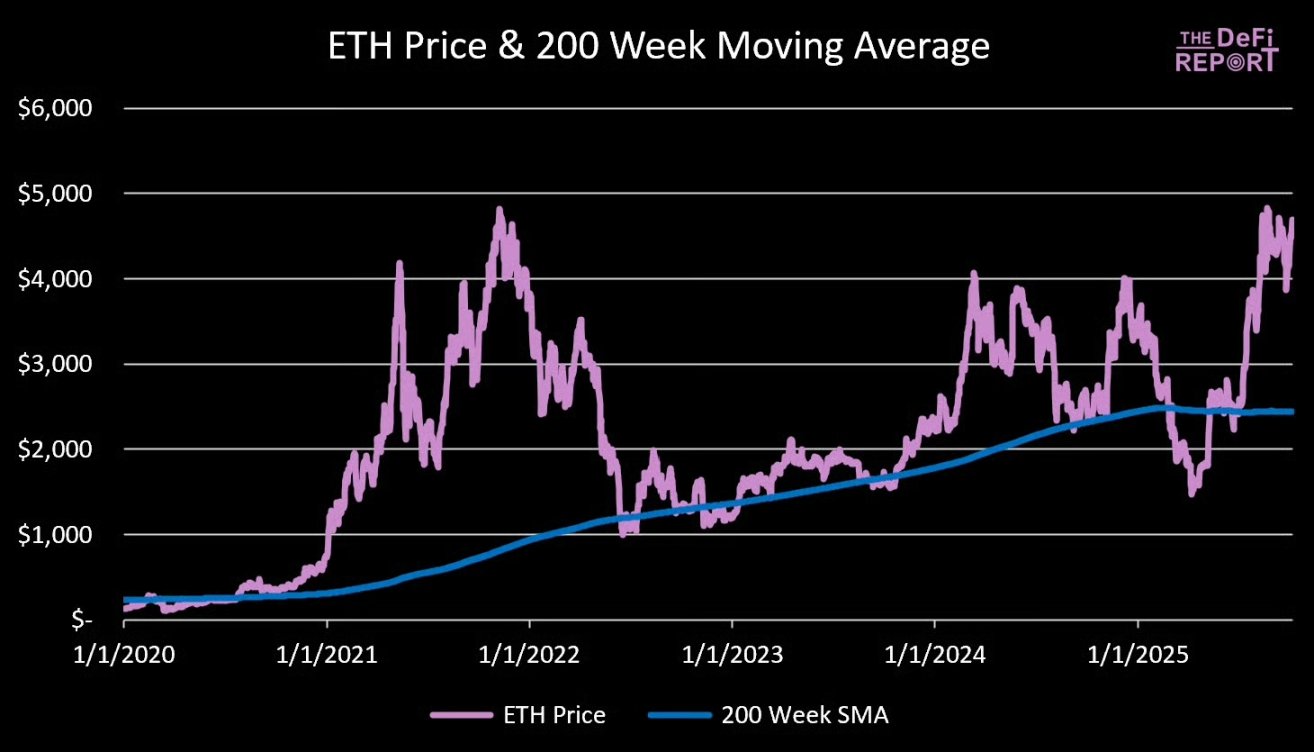
Data source: The DeFi Report
Currently, Ethereum is trading 92% above its 200-week moving average ($2,400).
At the market peak in the 2021 cycle, Ethereum prices were 492% above its 200-week moving average.
Scenario Analysis:
- 200% above the 200-week moving average: Ethereum at $7,300
- 250% above the 200-week moving average: Ethereum at $8,500
- 300% above the 200-week moving average: Ethereum at $9,800
- 350% above the 200-week moving average: Ethereum at $11,000
- 400% above the 200-week moving average: Ethereum at $12,200
Note: The 200-week moving average is a dynamic indicator, but over time, we are gradually replacing the price data from the $3,000-4,000 range of Ethereum from about four years ago. Therefore, we expect very little volatility in the 200-week moving average by the end of this year.
Ethereum Price to Realized Price Ratio
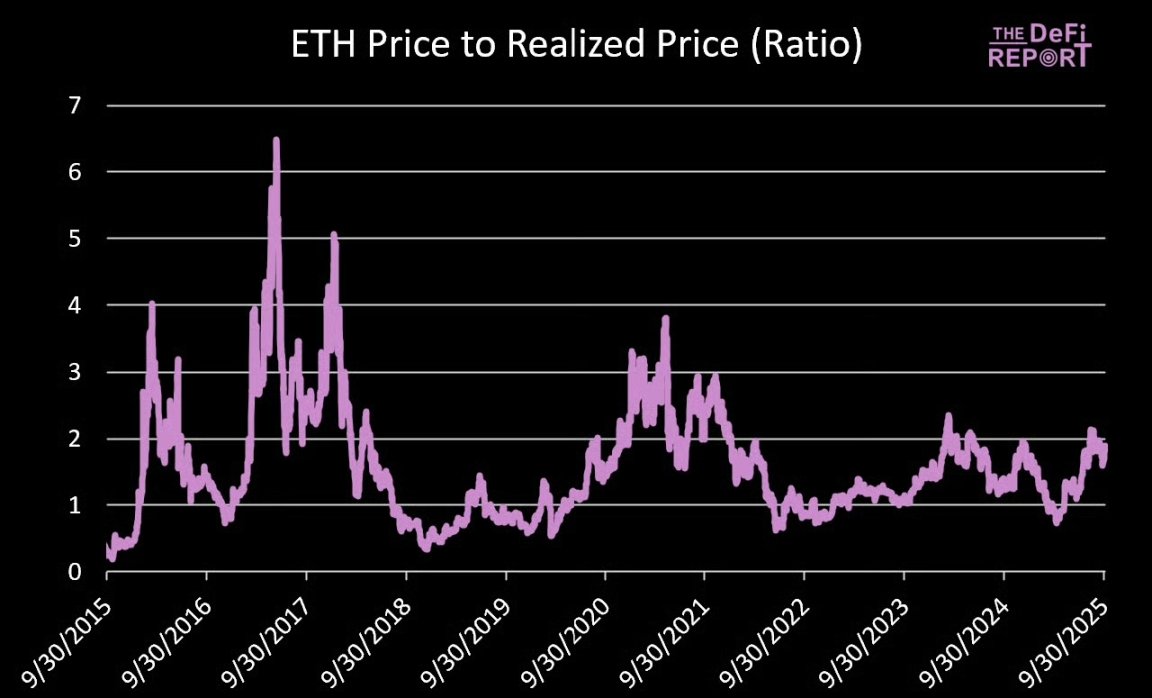
Data source: The DeFi Report, Glassnode
Realized price can be used as an alternative to the cost basis. Since January 1, 2017, the average ratio of Ethereum price to realized price has been 1.6. The current ratio is 1.9.
In the 2017 cycle, the ratio peaked at 5; in the 2021 cycle, the peak ratio in April was 3.5 and the peak ratio in November was 2.9.
Scenario analysis (assuming the ratio reaches 2.9):
- If the realized price is $3,000: Ethereum price is $8,700
- If the realized price is $3,500: Ethereum price is $10,200
- If the realized price is $4,000: Ethereum price is $11,600
MVRV Z-score
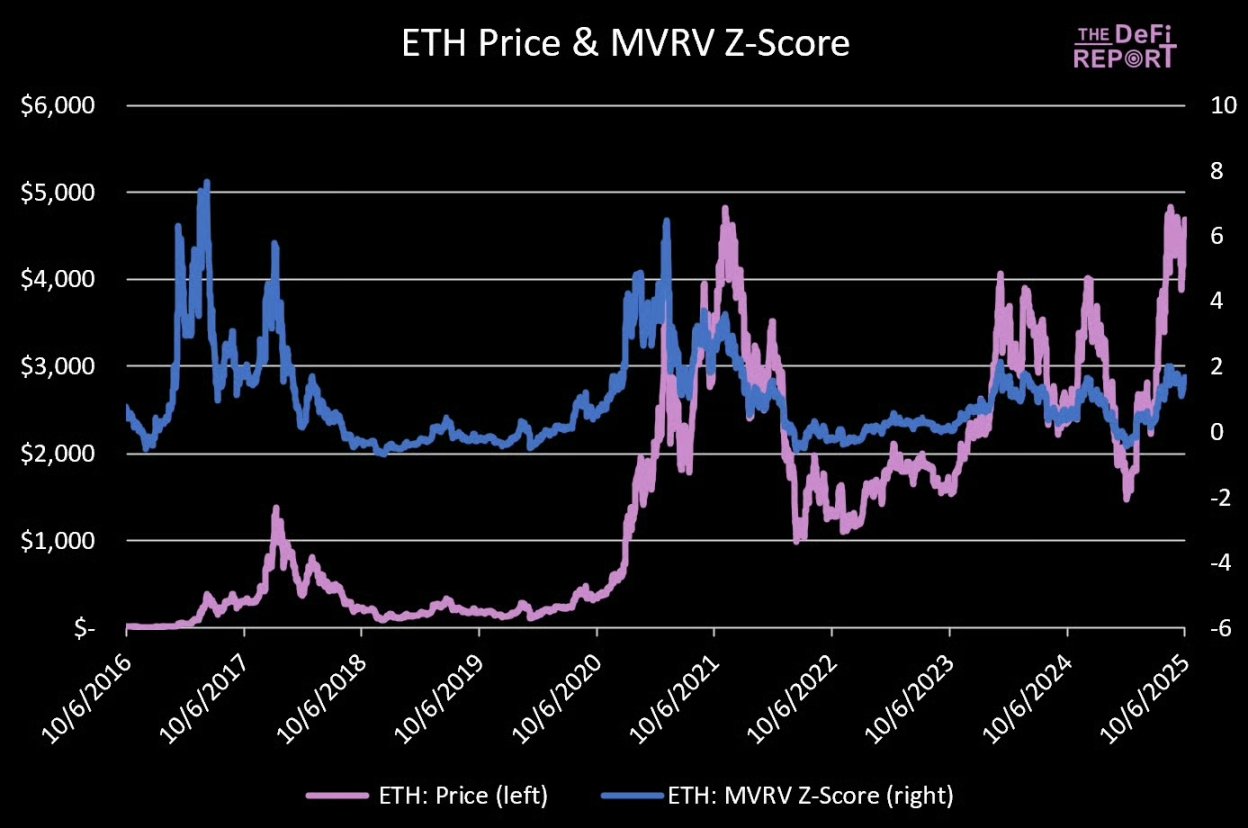
Data source: The DeFi Report, Glassnode
The Z-score measures how many “fluctuations” the market capitalization is above or below the on-chain cost benchmark. A higher Z-score indicates an overheated market, while a negative Z-score indicates an undervalued market.
Since January 1, 2017, Ethereum’s average Z-score has been 0.99, which indicates an overall bullish market bias.
The current Z value is 1.66, which is higher than the historical average but has not yet reached an overheated state.
In the 2021 cycle, the peak Z value was 6.5 in April and 3.48 in November.
Scenario Analysis:
- If the Z value is 2.21: Ethereum price is $7,000
- If the Z value is 2.77: Ethereum price is $8,000
- If the Z value is 3.33: Ethereum price is $9,000
- If the Z value is 3.9: Ethereum price is $10,000
Note: Assuming a 22% increase in realized prices (to $3,000) by the end of this year. For reference, realized prices have risen 24% since April of this year.
Ethereum vs. Bitcoin market capitalization
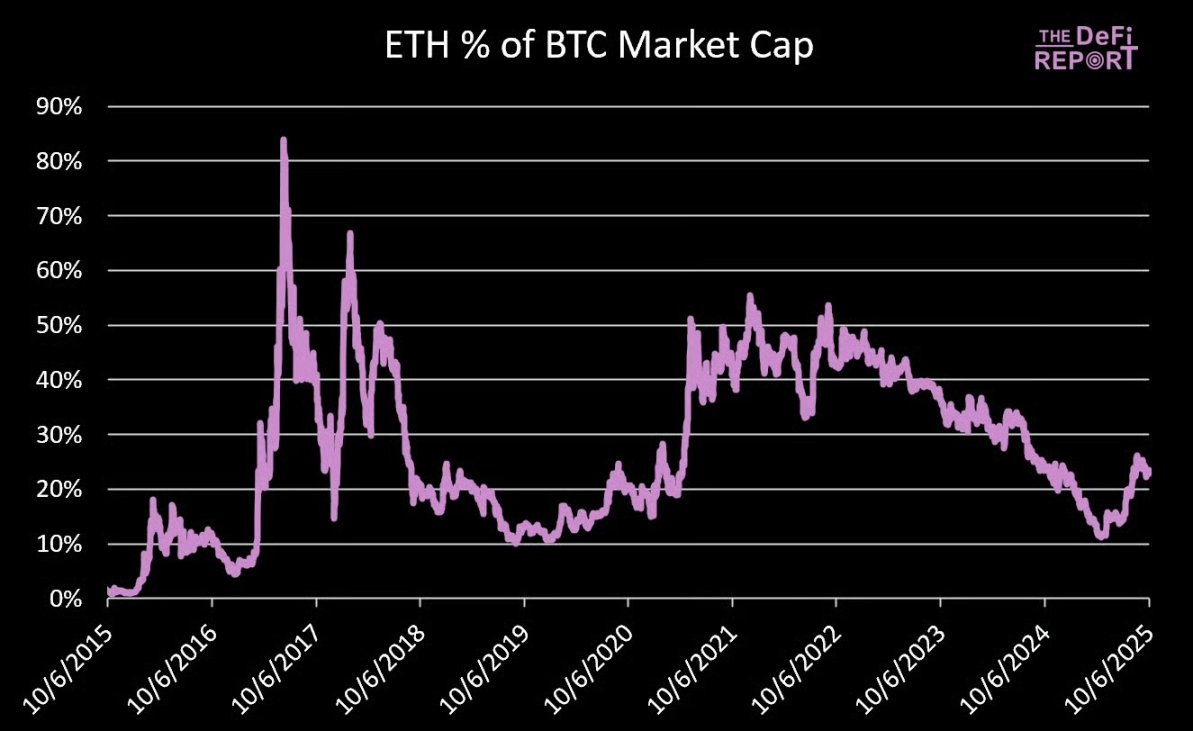
Data source: The DeFi Report
Currently, Ethereum’s market capitalization is approximately 23.4% of Bitcoin’s.
In November 2021, Ethereum's market value reached 55.5% of Bitcoin's market value.
If the price of Bitcoin reaches $150,000 (a 23% increase from its current level), its market capitalization would reach $3 trillion.
Scenario Analysis:
- If the market capitalization of Ethereum is 35% of the market capitalization of Bitcoin: the total market capitalization of Ethereum is 1.05 trillion US dollars, corresponding to a unit price of 8,658 US dollars
- If Ethereum's market capitalization is 45% of Bitcoin's: Ethereum's total market capitalization is $1.35 trillion, corresponding to a unit price of $11,132
- If Ethereum's market capitalization is 55% of Bitcoin's: Ethereum's total market capitalization is $1.64 trillion, corresponding to a unit price of $13,559
The core question is, will Bitcoin see a major rally? Will Ethereum's gains relative to Bitcoin be modest or explosive compared to the previous cycle?
Ethereum vs. Nasdaq
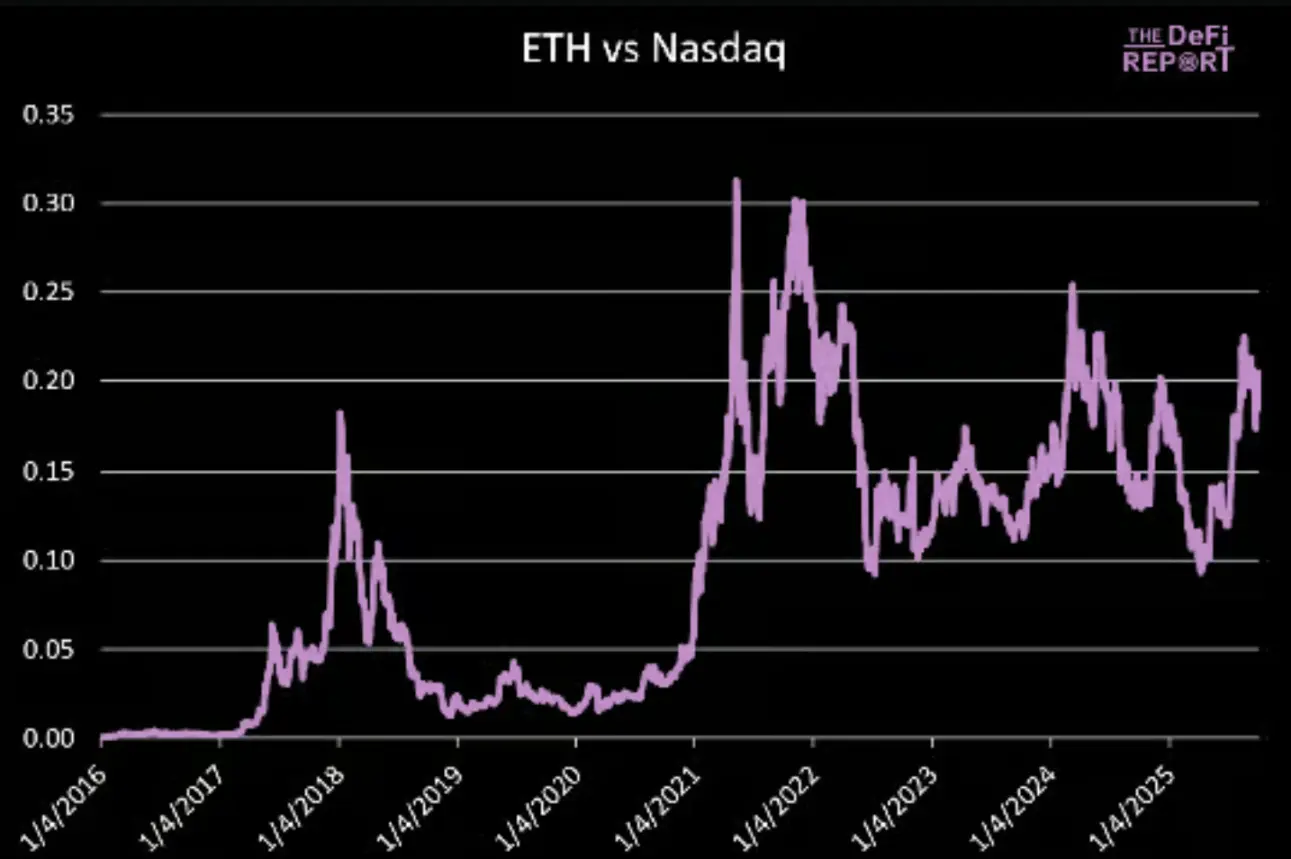
Data source: The DeFi Report
In May and November 2021, the ratio of Ethereum to the Nasdaq index peaked at 0.31 and 0.30 respectively.
The current ratio is 0.20, and the Nasdaq index is currently at 22,788 points.
If the Nasdaq index rises 5% by the end of this year (a cumulative increase of 23% for the year), its point will reach 23,927 points.
Ethereum price scenario analysis:
- If the ratio is 0.25: Ethereum price is $5981
- If the ratio is 0.30: Ethereum price is $7178
- If the ratio is 0.35: Ethereum price is $8,374
- If the ratio is 0.40: Ethereum price is $9,570
Our baseline assumption is that the cyclical upward trend in the Ethereum to Nasdaq ratio will continue, with the ratio reaching a new high (over 0.30) during this cycle.
Summarize
Our basic assumptions are as follows:
- Ethereum is 250% above its 200-week moving average, corresponding to a price of $8,500.
- The realized price reaches $3,000. If the price-to-realized price ratio is 2.9, the corresponding Ethereum price is $8,700.
- Ethereum's market capitalization reached 35% of Bitcoin's. If Bitcoin's price was $150,000, the corresponding Ethereum price would be $8,600.
- The ratio of Ethereum to the Nasdaq index hit a new high. If the ratio is 0.35, the corresponding Ethereum price is US$8,300.
If the bull market continues, the price of Ethereum may exceed $10,000; if the market turns bearish, Bitcoin's peak growth will be limited, and Ethereum will also be under pressure.
At the same time, as market sentiment heats up, more and more discussions about "cycle extension" have begun to emerge, which reminds me of the "super cycle" narrative that prevailed in 2021.
As we have stated before, the baseline assumption remains that Ethereum will reach its cycle peak this quarter.
