
Author: 0xWeilan
According to Coinbase, BTC reached a four-year low of $15,460.00 per coin on November 21, 2022. We regard this day as the end of the previous cycle and the beginning of this cycle.
From that date until September 30th of this year, BTC has been volatile for 1,044 days, approaching the peak of the previous two cycles (approximately 1,060 days after the low point). Using a simplistic calculation, BTC will reach the peak of this cycle in October 2025.
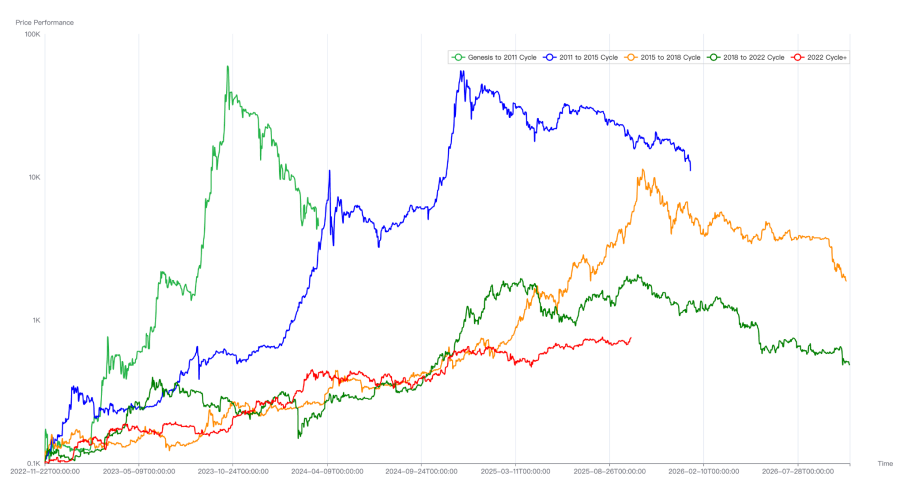
Comparison of BTC price trends over 5 cycles
This "cyclical" curse of Bitcoin stems from the speculative frenzy driven by the spread of consensus and the production cuts. It remains the most important cyclical indicator for traditional large Bitcoin holders. This group has played a decisive role in shaping past Bitcoin tops. It is this group's frantic profit-taking and selling, which drains liquidity and ultimately leads to the market's peak.
Currently, this group is accelerating their selling, suggesting a peak is imminent. However, other indicators of a top, such as a sharp rise in prices and a surge in new addresses, have not materialized. This raises questions: will this "cyclical law" continue to suppress the market, shaping a peak, or will it expire? Will the BTC bull market, which began in November 2022, end in October?
In this report, EMC Labs uses its proprietary "BTC Cycle Multi-Factor Analysis Model" to conduct a comprehensive analysis of BTC price trends since this cycle, clarifying which market forces and underlying logic truly drive the cycle, and ultimately providing our analysis and judgment on whether BTC prices will peak in October.
Phase 1 (November 2022~September 2023): Long-term holdings
Looking back, the bankruptcy of FTX, one of the major buyers in the previous cycle, and its lender, Voyager Digital, marked the completion of the cycle's liquidation. Following FTX's bankruptcy, the BTC price plummeted from the bottom of its range of $20,000 to $15,476 (according to Coinbase data, the same applies hereafter), with its lowest point occurring on November 21, 2024.
The bankruptcy of institutions like FTX hastened the market bottom, but the fundamental force that determines the end of the cycle is the profit-taking and selling of long-term investors. When the market is in a frenzy, short-term investors buy while long-term investors sell, and when the market cools, short-term investors sell while long-term investors increase their holdings.
Statistics on changes in long-term group positions in the previous period
As in previous cycles, long-term investors began accumulating shares during the bear market phase of the previous cycle. As the market entered the bottom phase, the scale of short-term losses began to decrease, and the buying power of long-term investors began to drive prices upward, pushing BTC and the crypto market out of the bottom and into a new cycle.
Meanwhile, the Federal Reserve's post-pandemic interest rate hike cycle is nearing its end, officially concluding on July 26, 2023. Due to forward trading, the Nasdaq Composite Index bottomed out on October 13, 2022, and broke out of its lower range in January 2023. Bitcoin prices have roughly tracked this trend, approximately 9-10 months before the official halt in interest rate hikes.
As the interest rate hike cycle nears its end, tightening monetary policy has led to bankruptcies at regional US banks (Silicon Valley Bank and First Republic Bank), forcing the US government to urgently release liquidity. The US M2/DXY index has begun to rebound, providing an external environment for a bottoming-out rebound in the US stock market and Bitcoin.
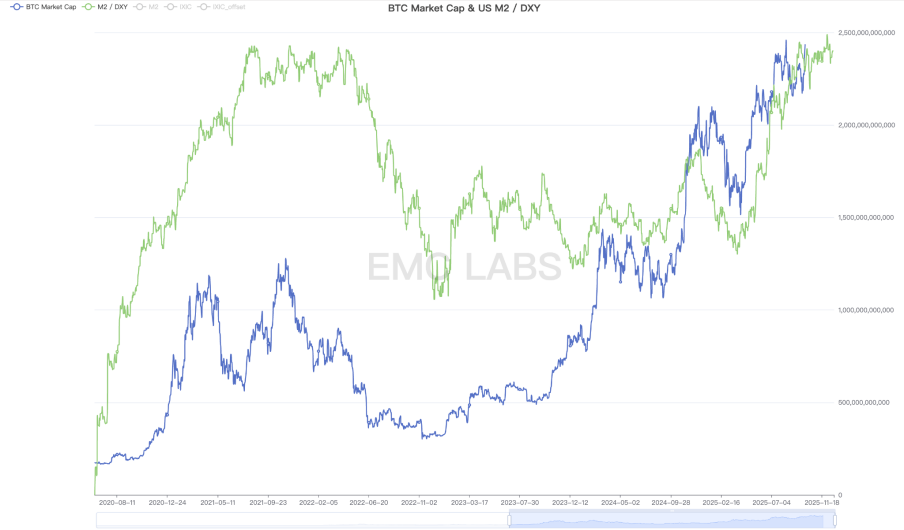
US M2/DXY
We define "November 2022-September 2023" as the first phase of this cycle. Coupled with improvements in macro liquidity, the tension generated by the internal holding structure of the crypto market will become the fundamental driving force behind BTC price increases during this phase.
The Fed's interest rate hikes officially ended in July 2023, and long-term holdings continued until the end of September 2023.
The DATs and BTC Spot ETFs, which would later become influential, had yet to become dominant forces, and retail investors, driven by rising and falling prices, had not yet awakened. During this period, stablecoin issuance was shrinking, and capital was still flowing out of the crypto market. Periodic increases in holdings by long-term investors were the primary driver of the market's upward trend.
In the first stage, BTC rebounded from a low of $15,476.00 to a high of $31,862.21, with a maximum increase of 105.88%.
Phase 2 (October 2023-March 2024): BTC Spot ETF
U.S. inflation continued to decline, and the brief rebound in CPI from July to September 2023 was considered a false alarm. July was finally confirmed as the end month of the Fed's current interest rate hike cycle.
As market expectations change, risky assets begin to be favored by funds. The change in risk appetite has prepared BTC for the launch of the second phase of the market.
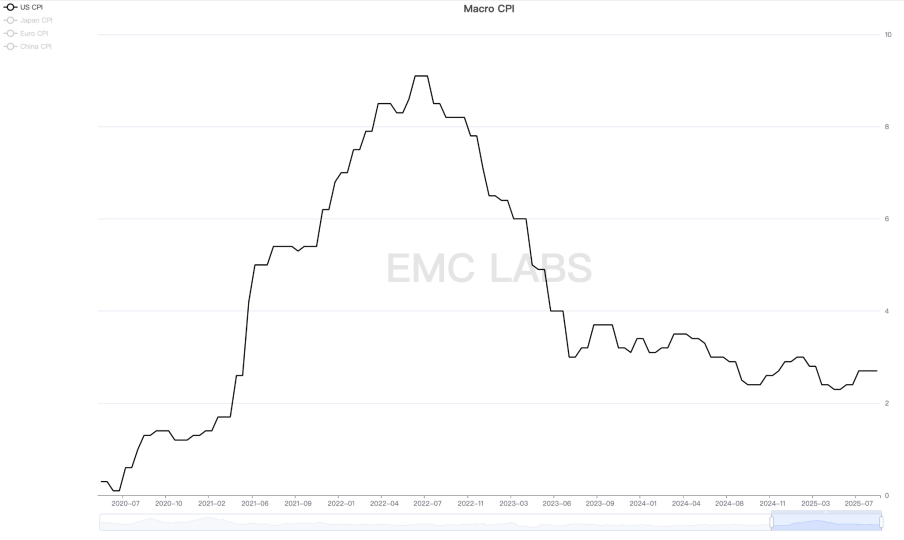
US CPI
What really drives BTC to start the second phase of this cycle is the expected approval of the BTC Spot ETF and the fifth BTC halving in April 2024.
Traditional Wall Street asset management giants such as BlackRock and Fidelity submitted BTC Spot ETF applications to the SEC in June 2023, and forward-looking speculative trading funds were secretly gathered.
Taking the SEC's approval of the BTC Spot ETF on January 10, 2024 as the dividing line, the second stage of the market is divided into the first and second halves. The first half (2023.10~2024.01.10) is dominated by speculative funds betting on the ETF approval, and the second half (2024.01.10~2024.03.14) is dominated by incremental funds brought by the ETF channel (over US$12 billion).

Monthly statistics on fund flows in BTC Spot ETF and stablecoin channels
In addition, the stablecoin channel completely got rid of the outflow trend in October and resumed inflow. By the end of March, the total new issuance exceeded US$26 billion, which was one of the main driving forces in the first half.
Since the start of this phase of the market in October 2024, the long-term holding group began to reduce their holdings, and by the end of the market, the scale of reduction reached as much as 900,000 pieces.
The market during this period was driven by speculative/investment funds within the BTC Spot ETF channel, on-exchange speculative/investment funds (manifested by a large increase in stablecoin issuance), and long-term selling. Buying power outweighed selling pressure, driving a sharp and aggressive rise in BTC prices.
In the second stage, BTC rose from a low of $26,955.25 to a high of $73,835.57, with a maximum increase of 173.92%.
Phase 3 (April 2024~September 2024): Halving and Rebalancing
In our second-phase analysis, we noted that investment and speculative capital based on the traditional narrative of Bitcoin production cuts was also a significant factor in determining market trends. This was clearly reflected in the third-phase market trends.
On April 19, 2024, Bitcoin completed its fourth halving, reducing the block reward from 6.25 BTC to 3.125 BTC. Although over 95% of BTC has already entered circulation, significantly reducing the impact of the halving on actual market supply, the speculation surrounding the halving did indeed overdraw BTC's upward potential. From April to September 2024, BTC entered a seven-month period of volatile adjustments.
Funding statistics show that after BTC reached a temporary peak in March, the scale of capital inflows into the BTC Spot ETF channel shrank but remained at a high level. However, the stablecoin channel shrank even more, and even turned to outflow at one point.
Monthly statistics on fund flows in BTC Spot ETF and stablecoin channels
During this period, although the Federal Reserve has stopped raising interest rates, it has not yet started to cut interest rates. The scale of fund inflows into the ETF channel has decreased significantly. In addition, on-site funds have left the market with the arrival of the halving. The overdrawn market has to be revised downward to seek a new price balance.
The market was able to rebalance, avoiding a bear market, thanks to the stabilizing force of the long-term holding group. We noticed that after April, as liquidity receded, long-term holders stopped reducing their holdings, and then began increasing their holdings after July. This behavior of long-term holders is consistent with the group's past behavior, marking a temporary bottom for the market.
In the third stage, the highest price was $109,588, the lowest price was $74,508, and the maximum drop was 32.01%, which did not exceed the BTC bull market correction threshold.
Phase 4 (October 2024-January 2025): Trump’s Crypto-Friendly Policies
After halting interest rate cuts in July 2023, the federal funds rate remained elevated at 5.25-5.50 to suppress a decline in the CPI. High interest rates gradually undermined the job market, prompting the Fed to resume cutting rates at its September 2024 meeting, completing a 75 basis point reduction by the end of the year.
Interest rate cuts have boosted risk appetite across the market, leading to a massive influx of funds into the crypto market through BTC Spot ETFs and stablecoin channels. By the end of January 2025, 11 BTC Spot ETFs in the United States had assets under management exceeding $100 billion, setting multiple historical records. This demonstrates that the BTC "digital gold" narrative has gained favor on Wall Street, and BTC is transitioning from an alternative asset to a mainstream one.
In addition to interest rate cuts, another catalyst for BTC's rise was the US presidential election. During this campaign, Republican candidate Donald John Trump's attitude towards cryptocurrencies changed 180 degrees, becoming the most "crypto-friendly" presidential candidate in the United States. His family business even issued the MEME token Trump after his victory.
Since taking office, Trump has signed executive orders supporting digital assets and blockchain technology, established an interagency working group to review existing regulatory policies, announced the establishment of a "Bitcoin Strategic Reserve" and a "U.S. Digital Asset Reserve," and signed the GENIUS Act to promote the compliant development of stablecoins. Furthermore, he has appointed "crypto-friendly" individuals to the positions of Secretary of the Treasury and Chairman of the SEC, effectively promoting the development of crypto assets and blockchain technology in the United States. This level of friendly attitude and intensive policymaking is unprecedented, and even Satoshi Nakamoto would find it unbelievable.
With the Trump campaign, massive amounts of funds were rapidly injected into the crypto market through ETFs and stablecoins, forming the largest capital inflow so far in this cycle. At the same time, long-term investors once again started selling to lock in profits.
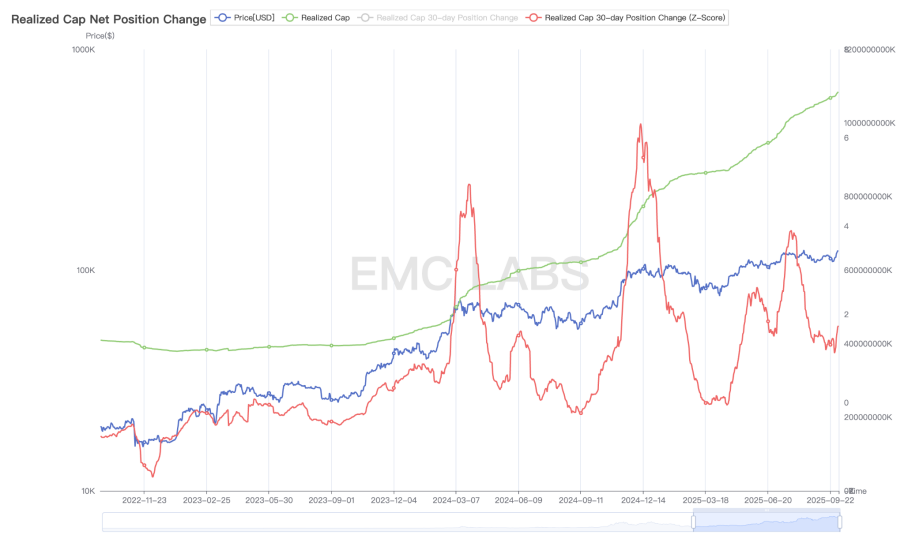
Statistics on the value realization of the BitNetwork chain
Driven by crypto-friendly policies in the United States, crypto assets are gradually becoming mainstream assets in the country. In addition to the BTC Spot ETF, dozens of DATs, represented by Strategy, have joined the race to accumulate BTC and other crypto assets. These two groups have become the largest buyers of BTC.
BTC Spot ETF and DATs companies hold more than or close to 5% of BTC.
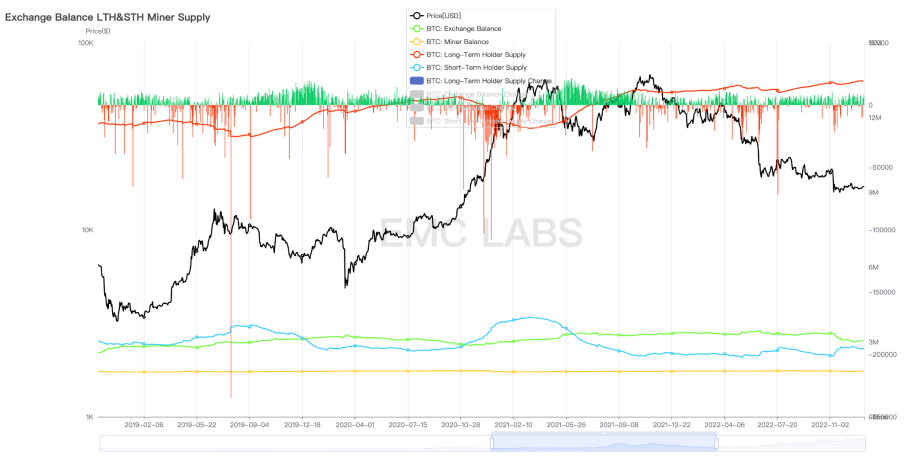
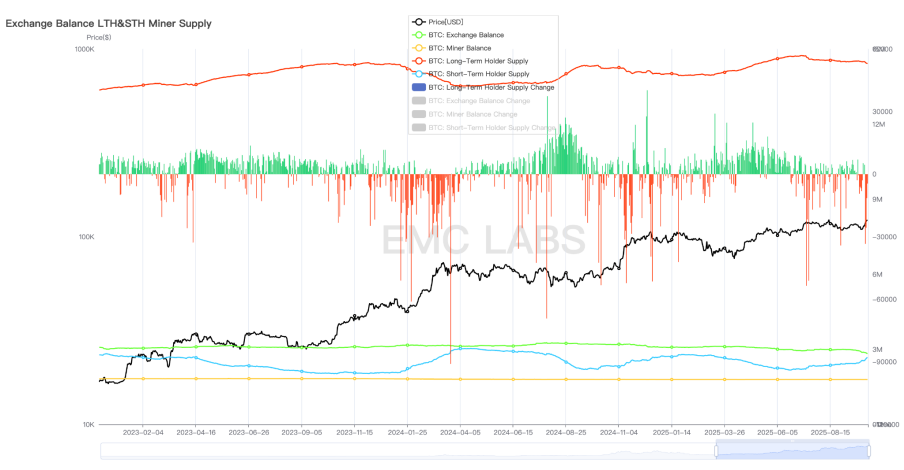
With the massive entry of the BTC Spot ETF and DATs, BTC is entering a period of significant turnover. Large amounts of BTC are being transferred from early holders into the custody accounts of BTC Spot ETFs and DATs. This has caused a significant decline in the amount of BTC held on centralized exchanges, a common practice among early crypto holders. By the end of September 2025, over 400,000 BTC had flowed out of centralized exchange management addresses, representing a value of over $40 billion at $100,000 per BTC.
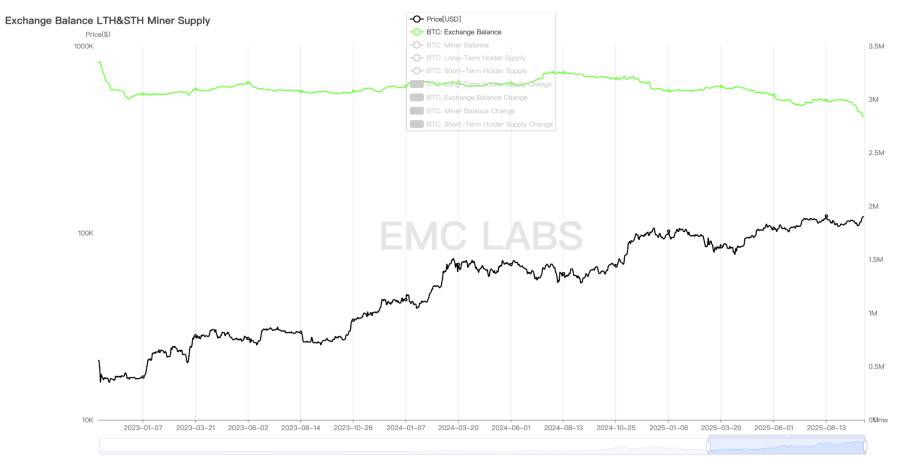
BTC inventory statistics of major crypto asset exchanges
This outflow continued during and after this phase, demonstrating that BTC is currently undergoing a historic turnover. Early investors (including those who have held for more than seven years) are cashing out significant profits, while traditional funds are transitioning to long-term investors in the asset. The behavior of early investors is significantly influenced by the halving cycle, while DATs appear to favor continuous buying and long-term holding. The behavior of holders of the BTC Spot ETF channel is more influenced by US stock market trends.
This change in the coin holding structure makes the BTC cycle more complicated.
The market momentum during this period came from speculation brought about by interest rate cuts and expectations of Trump's crypto-friendly policies, and the crypto market received record capital inflows during this period.
In the fourth stage, the BTC price rose from a low of $63,301.25 to $109,358.01 (recorded on January 20, 2025, the day Trump took office), with the maximum increase reaching 72.76%.
Phase 5 (February 2025~April 2025): Black Swan
In our research framework, the fifth phase represents another mid-term adjustment, triggered by external black swan events and a resurgence of sentiment following enthusiastic speculation. The market turmoil unleashed by the pause in interest rate cuts and the tariff war reached a threshold both in terms of time and space, ultimately forming this unique phase.
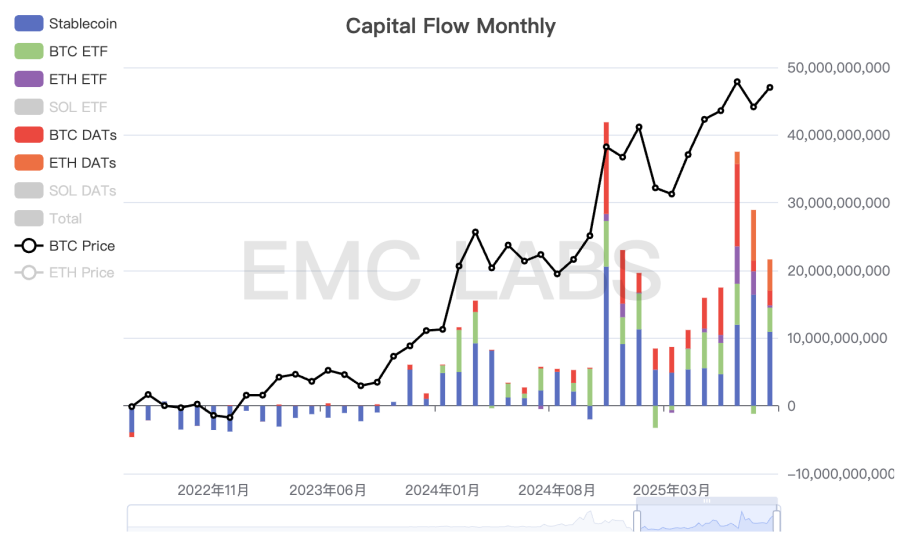
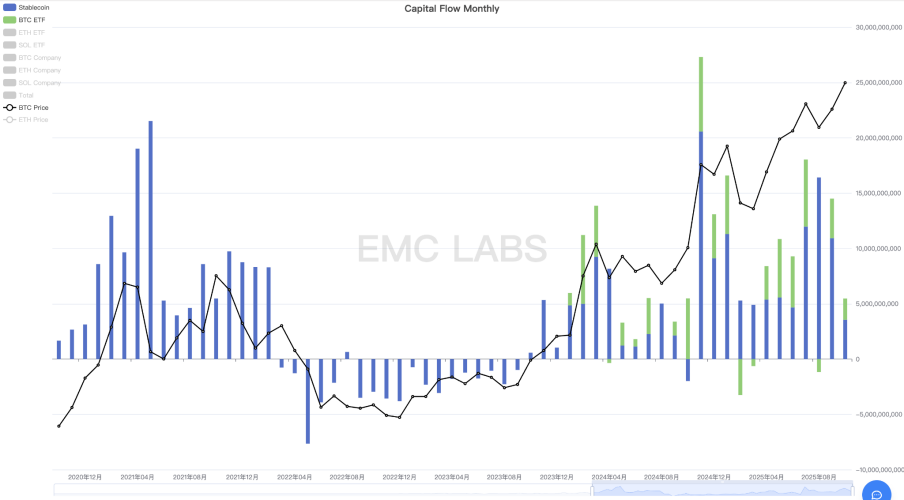
Monthly statistics on crypto market capital flows
Because the US stock and crypto markets had already fully priced in continued interest rate cuts, when the Federal Reserve stopped cutting rates in January 2025 and refocused on reducing inflation, the historically high US stock and Bitcoin prices entered a precarious situation. When Trump announced tariffs far exceeding expectations, the market plummeted.
The Nasdaq's maximum correction from its peak was nearly 17%, while BTC's maximum correction reached 32%. While BTC's decline was significant, it still did not exceed BTC's correction threshold in a bull market.
Ultimately, as the panic caused by the tariff war and concerns about a hard landing of the US economy subsided, both the US stock market and the crypto market achieved a V-shaped reversal in April and continued to set new historical highs after July.
Behind the V-shaped reversal, funds from DATs companies, BTC Spot ETF channels and stablecoin channels rushed to buy shares. In addition, the long-term holding group returned to increase holdings in a timely manner after the decline, once again playing the role of a market stabilizer.
In the fifth stage, the highest price was $73,777, the lowest price was $49,000, and the maximum drop was 33.58%, which did not exceed the scale of the BTC bull market correction.
Phase 6 (May 2025~): Old Cycle and New Cycle
The market crash caused by the black swan was gradually recovered by bargain-hunting funds and long-term holdings. By July, BTC had hit a historical high of $123,000.
At this point, the long-term investors initiated the third major sell-off of this cycle, which continues to this day. The investors were DATs and BTC Spot ETF channel funds.
Before the September rate cut, forward-looking trading continued to dominate the market. From July to September, funds inflows surged, but the scale of inflows gradually decreased, leading to a slight correction in BTC after the rate cut. Long-term divestment became the primary activity influencing market movements.
BTC long-term holdings statistics
Since the beginning of this cycle, accompanied by the third wave of price increases, long-term investors have been engaged in a third round of large-scale selling. According to on-chain data, long-term investors have locked in profits exceeding 3.5 million BTC during this cycle, a figure that has already reached the threshold reached at the top of previous cycles. As of today, long-term investors are still continuing to sell off BTC significantly.
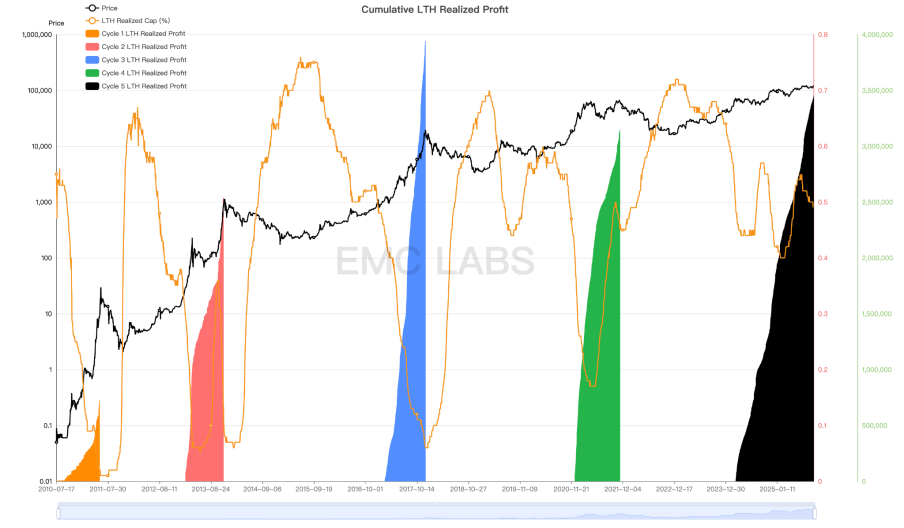
BTC long-term profit statistics (BTC)
In previous bull-bear cycles triggered by Bitcoin halvings, the reduction in Bitcoin production and the accumulation and distribution of long-term holdings were the decisive factors in the formation of the cycle. The speculative sentiment surrounding the production cuts, driving the entry of new investors, was a necessary condition for the formation of the cycle top. In previous cycles, this influx of new speculators manifested itself as a surge in new addresses in Bitcoin network wallets.
However, as consensus on BTC spreads, the number of new addresses created by BTC in each cycle has stagnated. Since 2024, the number of new BTC addresses has fallen to levels seen during previous bear markets. Of course, this cannot simply be attributed to a decrease in new entrants. After the approval of 11 BTC Spot ETFs in the United States in January 2024, many investors began using ETF channels to participate, significantly reducing the creation of BTC wallet addresses.
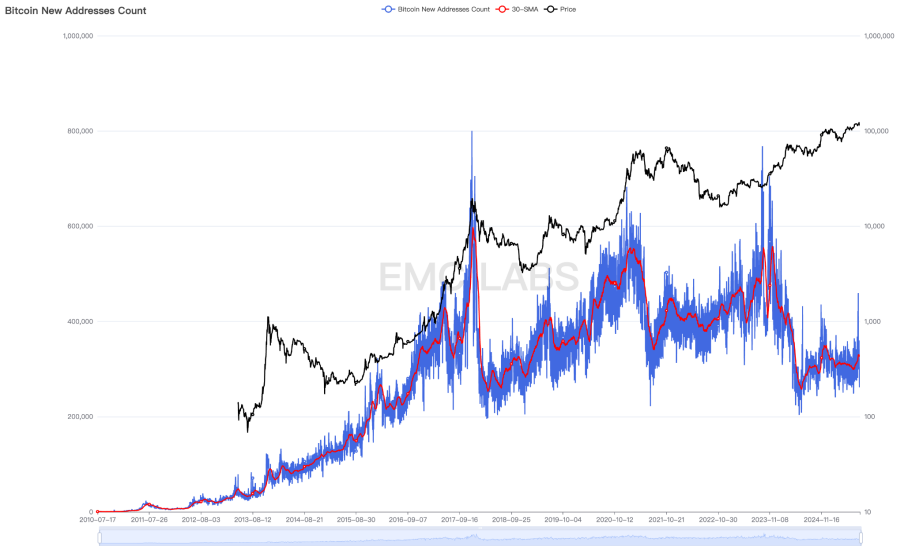
Statistics of new addresses added to BitNet
But when looking at Ethereum, the largest SCP platform, we can notice the same pattern in terms of newly added addresses during this period.
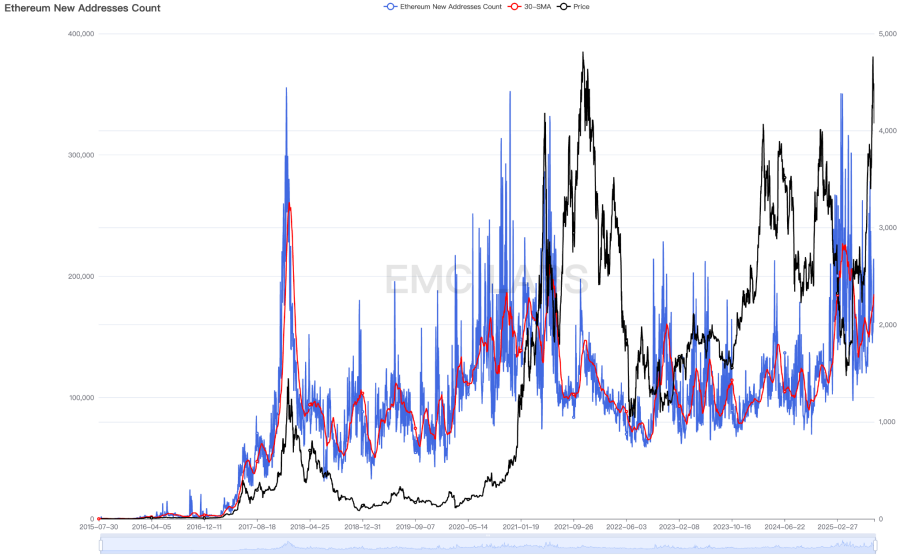
Ethereum new address statistics
This leads us to believe that the BTC market structure has undergone a dramatic shift, and the entire crypto market is entering a new phase of development. Simply predicting market tops based on cyclical patterns or blindly buying into hot currencies in the hope of high returns are outdated.
Even BTC may have already stepped out of the old cycle and entered a new cycle, and its peaking method, peaking time and bear market correction amplitude may change completely.
Conclusion
From the above review and observation, we have come to a preliminary conclusion: the driving force of this bull market mainly comes from the promotion of industrial policies and incremental funds from traditional channels. Production cuts and industrial innovation have failed to bring in huge capital inflows as in the past, thereby triggering a comprehensive bull market in the Crypto market with all currencies soaring.
Although during this bull market, the industry has also seen innovations in niche areas such as Ethereum Layer 2, BTC Ordinals, Restaking, Solana Renaissance, and DePhin, compared with the previous ICO and DeFi craze, the funds attracted by these innovations are pulsed and extremely limited.
As a result, since BTC restarted a new bull market cycle in November 2022, the prices of most coins and tokens in the crypto market have only seen pulsed, periodic increases. Even ETH, the SCP platform token with the largest consensus and the most use cases, saw its price fall back to the starting point of the bull market in 2025.
BTC is emerging from its old cycle and entering a new one. Driven by market sentiment and their own logic, funds from DATs and the BTC Spot ETF are attempting to reshape the logic and form of the cycle. However, the group of long-term BTC holders, who have played a decisive role in the cyclical movement over the past 16 years, still holds over 15 million BTC, representing 70% of all issued BTC, and this group continues to act according to the cyclical law.
Factors supporting the fact that the market has not yet peaked or even entered a new cycle include: DATs companies' outstanding fundraising capabilities and long-term holding strategies, the United States is still introducing and implementing crypto-friendly policies, and the high-risk asset allocation trend caused by the restart of the interest rate cut cycle.
Will long-term investors diligently squeeze out liquidity to complete the top of the old cycle, or will buying power in an interest rate cut environment bury selling pressure and follow the US stock market into a new long bull cycle? This game is still ongoing.
We believe the cycle will be extended. While a BTC peak in October remains a low probability event, if long-term investors continue to sell, the bull market will likely end this year. The length and scope of the subsequent bear market correction could be significantly reduced, depending on the behavior of new buyers.
The end has begun.
