
Author: CoinGecko
Compiled by: Shan Ouba, Golden Finance
Cryptocurrency markets have suffered a setback at the start of 2025, in stark contrast to the frenetic highs of late 2024. The total cryptocurrency market cap fell -18.6% in Q1 to close at $2.8 trillion, after briefly hitting $3.8 trillion on January 18th – just before Donald Trump’s inauguration. The decline was accompanied by a drop in investor activity, with average daily trading volume plunging -27.3% quarter-over-quarter to $146 billion.
Amid the market downturn, Bitcoin strengthened its dominance, reaching 59.1% at the end of the first quarter — its highest level since early 2021 — as altcoins bore the brunt of the decline. Although Bitcoin hit an all-time high of $106,182 in January, it had fallen back to $82,514 by the end of the quarter, a drop of -11.8%.
Our comprehensive Q1 2025 Crypto Industry Report covers everything from an overview of the cryptocurrency market to analyzing Bitcoin and Ethereum, taking a deep dive into the decentralized finance (DeFi) and non-fungible token (NFT) ecosystems, and reviewing the performance of centralized exchanges (CEX) and decentralized exchanges (DEX).
8 highlights from CoinGecko’s Q1 2025 Cryptocurrency Industry Report
- Total cryptocurrency market capitalization fell -18.6% in Q1 2025, having previously hit a year-to-date high of $3.8 trillion
- Bitcoin’s dominance increases, now accounting for 59.1% of total cryptocurrency market capitalization
- Bitcoin down -11.8% in Q1 2025, underperforming gold and U.S. Treasuries
- Ethereum price plummets from $3,336 to $1,805 in Q1 2025, wiping out all gains made in 2024
- After the Libra incident, Meme coins plummeted, and the number of tokens deployed daily on Pump.fun dropped sharply by -56.3%
- In the first quarter of 2025, the spot trading volume of centralized exchanges reached 5.4 trillion US dollars, a decrease of -16.3% from the previous quarter.
- Solana continued its dominance in on-chain spot DEX trading since late 2024, accounting for 39.6% of all transactions in Q1 2025
- In the first quarter of 2025, the total TVL of Multichain DeFi evaporated by $48.9 billion, a decrease of -27.5%
1. Total cryptocurrency market cap fell -18.6% in Q1 2025, having previously hit a year-to-date high of $3.8 trillion
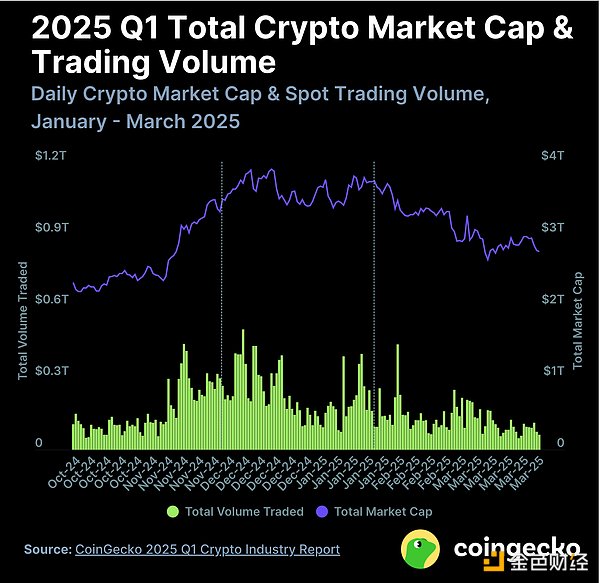
The total cryptocurrency market capitalization fell by -18.6% ($633.5 billion) to close at $2.8 trillion at the end of Q1 2025. The market hit a local high of $3.8 trillion on January 18, two days before Donald Trump’s inauguration. However, thereafter the market trended downwards for the rest of the quarter.
Meanwhile, average daily trading volume also fell sharply in the first quarter, down -27.3% quarter-on-quarter to $146 billion. The trading volume in the fourth quarter of 2024 was $200.7 billion.
2. Bitcoin’s dominance has increased, now accounting for 59.1% of the total cryptocurrency market capitalization
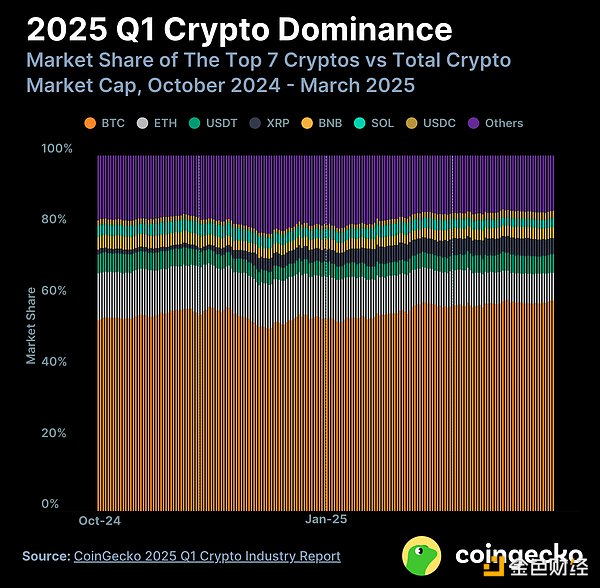
Bitcoin (BTC) dominance continues to climb, increasing by 4.6 percentage points in the first quarter of 2025. Amid a sell-off that hit altcoins, Bitcoin’s dominance reached 59.1% at the end of the quarter. This is the highest level since the first quarter of 2021.
Stablecoins also benefited from the market drop as investors flocked to stablecoins. Tether (USDT) saw a slight increase in market share to 5.2%, while USDC reclaimed the seventh spot, replacing Dogecoin (DOGE).
Ethereum (ETH) fell sharply in Q1, down -3.9 percentage points, and its dominance is 7.9%, the lowest level since late 2019. The "Other" category saw a smaller drop, down -3.5 percentage points, accounting for 15.7% of the market share. Among the major coins, only XRP and BNB managed to maintain their market share.
3. Bitcoin is down -11.8% in Q1 2025, underperforming gold and U.S. Treasuries
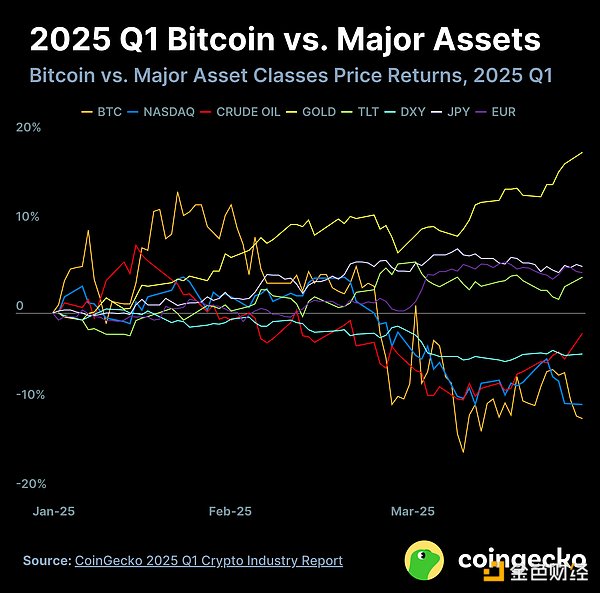
Bitcoin (BTC) rebounded at the start of the year, reaching a slightly new all-time high of $106,182 on January 22, 2025. This was two days after Trump’s inauguration, marking Bitcoin’s year-to-date high, before trending downwards, ending the first quarter with a loss of -11.8% to $82,514.
In this turbulent and uncertain quarter, gold (+18.0%) became the strongest performing asset class in Q1 2025. Along with Bitcoin, risk assets such as the Nasdaq and S&P 500 also fell, falling by -10.3% and -4.4%, respectively.
The US dollar index (DXY), which typically correlates negatively with risk assets, fell -4.6%, likely due to uncertainty about US tariffs. The yen (+5.2%) and euro (+4.5%) strengthened against the dollar, the former at least in part due to further unwinding of yen carry trades following the Bank of Japan's January rate hike.
4. Ethereum price plummets from $3,336 to $1,805 in Q1 2025, wiping out all gains in 2024
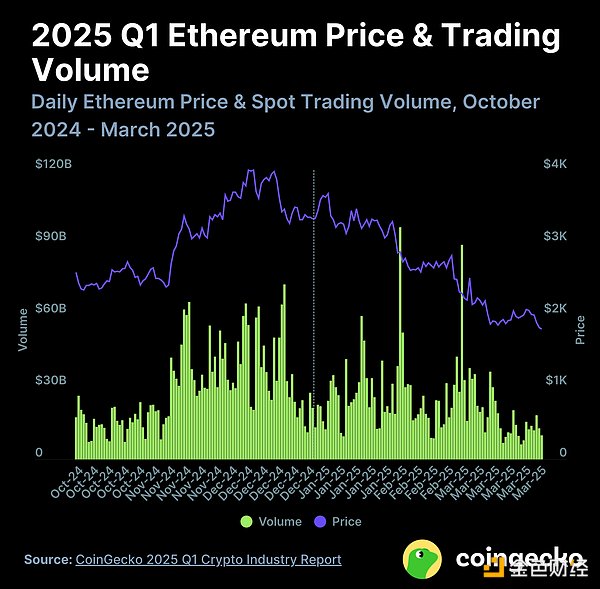
Ethereum (ETH) closed at $1,805 at the end of Q1 2025, down -45.3% on the quarter, having previously reached $3,336. It has wiped out all of its gains in 2024 and is back to 2023 levels. It has underperformed majors like Bitcoin, Solana, XRP, and BNB, which have seen much smaller declines.
Trading volume also fell in the first quarter, from an average of $30 billion per day in the fourth quarter of 2024 to $24.4 billion this quarter. Days with surging trading volume are often accompanied by a plunge in the price of Ethereum.
5. After the Libra incident, Meme coins plummeted, and the number of tokens deployed daily on Pump.fun dropped sharply by -56.3%
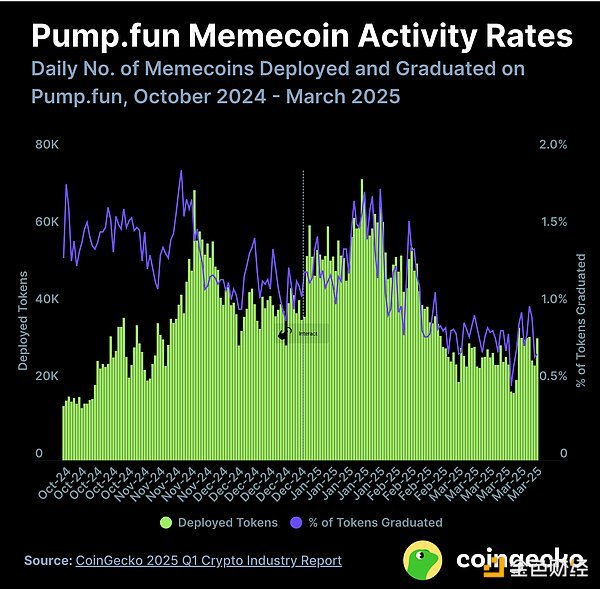
The sudden launch of Trump’s official TRUMP Meme coin ahead of his inauguration, and MELANIA shortly thereafter, sparked a wave of meme coin frenzy and pushed the number of tokens deployed daily on Pump.fun to an all-time high of 72,000.
This gave rise to a trend of “political meme coins”, with dozens of tokens associated with politicians and countries being launched. However, this trend came to an abrupt end with the launch of LIBRA, promoted by Argentine President Javier Milley. Shortly after his tweet promoting it, the token’s price plummeted as developers conducted a Rug Pull, causing its market value to drop from a peak of $4.6 billion to $221 million in just a few hours.
Activity on Pump.fun has since dropped significantly, with the number of tokens deployed daily falling by more than -56.3% from its January peak to 31K at the end of Q1 2025. The rate of “graduated” tokens has also dropped from 1.4% in January to 0.7% at the end of the quarter.
6. In the first quarter of 2025, the spot trading volume of centralized exchanges reached 5.4 trillion US dollars, a decrease of -16.3% from the previous quarter.
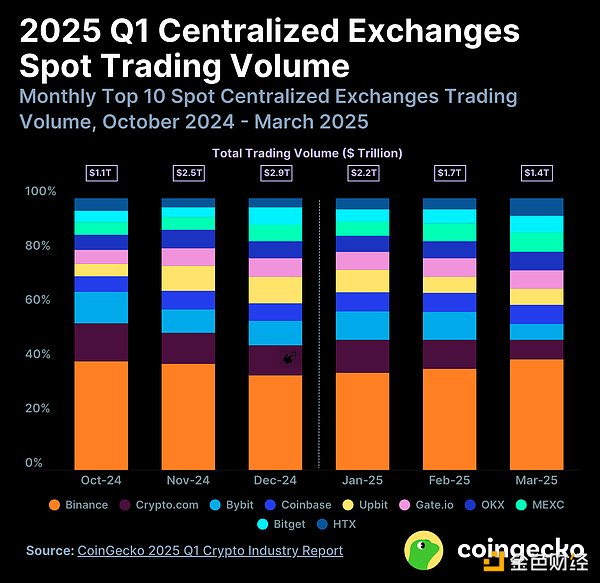
In the first quarter of 2025, the spot trading volume of the top 10 centralized exchanges (CEX) was US$5.4 trillion, a decrease of -16.3% month-on-month.
Binance remains the dominant spot CEX with a market share of 40.7% in March. Its market share continued to climb during the quarter. However, its trading volume plummeted to $588.7 billion in March, having previously exceeded the $1 trillion mark in December.
HTX was the only exchange among the top 10 to see growth in Q1, with a +11.4% increase in volume. The other top 10 CEXs saw volume declines between -1.8% and 34.0%. Upbit saw the biggest drop, with volume plunging -34.0% from $561.9 billion in Q4 2024 to $371.0 billion in Q1 2025.
Bybit saw the largest month-over-month drop, falling from $178.2 billion to $84.7 billion, a drop of -52.4%, following a major hack in February.
7. Solana continues to dominate on-chain spot decentralized exchange transactions since the end of 2024, accounting for 39.6% of all transactions in the first quarter of 2025
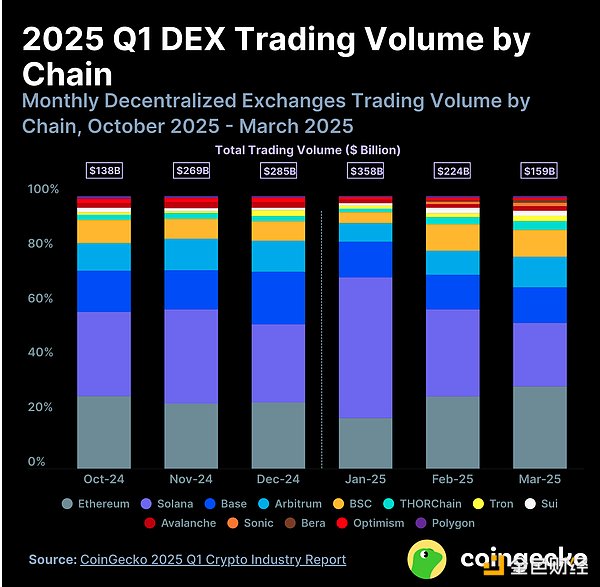
Continuing the trend at the end of 2024, Solana continues to dominate DEX trading, with a market share of 52% in January 2025; new entrants Sonic and Bera are emerging.
Solana was the dominant chain for DEX transactions in Q1 2025, reaching a quarterly market share of 39.6%. It grew by +35.3%, from $217 billion in Q4 to $293.7 billion in Q1.
In January, driven by the "political meme coin" craze led by $TRUMP, Solana accounted for 52% of the transactions on the top 12 blockchains. Its transaction volume exceeded $184.8 billion, setting a record high for the chain. This caused Ethereum's market share to fall below 20% for the first time.
However, as the meme coin trend faded, Ethereum managed to reclaim the top spot in March with a market share of 30.1%, while Solana had 23.4%.
Optimism and Polygon were squeezed out of the top 10 in March by newcomers Sonic and Berachain. However, for the entire quarter, the two chains still lead.
8. In the first quarter of 2025, the total TVL of Multichain DeFi evaporated by US$48.9 billion, a decrease of -27.5%
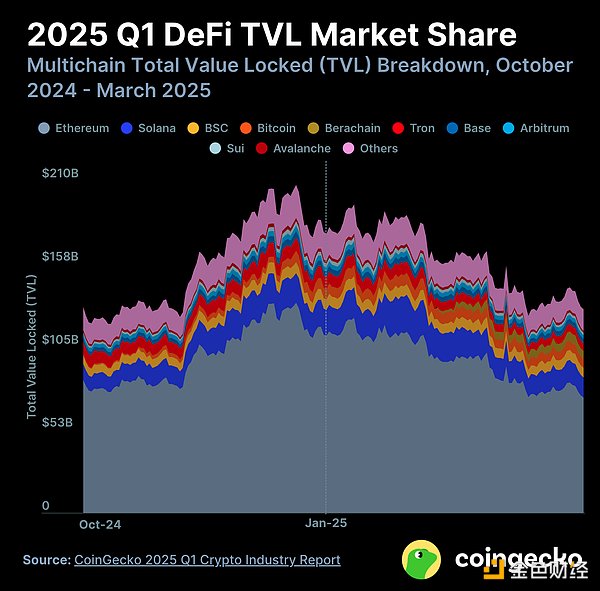
The Total Value Locked (TVL) in Multichain DeFi has been on a downward trend in Q1 2025, falling by -27.5% from $177.4 billion at the end of 2024 to $128.6 billion at the end of March 2025. This is mainly due to the significant depreciation in the value of altcoins.
Ethereum in particular lost a significant portion of its TVL, with its dominance falling from 63.5% at the beginning of 2025 to 56.6% at the end of Q1. Its TVL fell by 35.4%, from $112.6 billion to $72.7 billion.
Solana and Base also saw significant drops in TVL, down -23.5% and -15.3% respectively, but this was mainly due to the sharp price drops for SOL and ETH. Nonetheless, both networks saw small increases in TVL dominance.
Berachain, which launched on February 6, has rapidly grown to $5.2 billion in DeFi TVL by the end of Q1 2025 and currently holds the sixth-largest share of TVL. Its Boyco pre-deposit vault alone attracted around $2.3 billion in funding, boosting its first-day liquidity.
