
by doug funnie
Compiled by Tim, PANews
Why I don't think we've reached peak bull market
I haven't made this prediction since the beginning of 2024.
What we will discuss:
- On-chain metrics
- Monthly RSI indicator
- Business cycle correlation (PMI)
- 50-week moving average support
- Recent headlines
- "The charts showed signs of this early on."
- Total cryptocurrency market capitalization (excluding Bitcoin)
- social media
1) On-chain metrics
It's important to recognize that all of this is subject to diminishing returns.
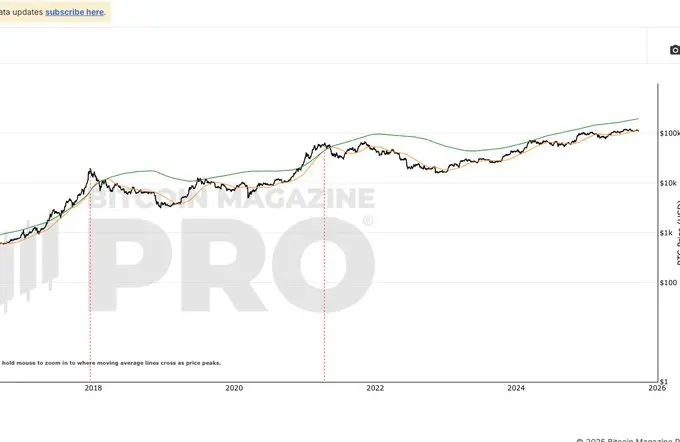
First, let's look at the Pi cycle top. While the orange line crossed the green line before forming the top, the degree of this crossover has decreased over the past three cycles. Assuming a super-diminishing returns effect, they don't even intersect. Currently, the green line is at 190,000, and the orange line is at 112,000. The green line continues to rise over time, and is about to reach 200,000 and continue rising.
Even accounting for the -50% diminishing returns, this surge took Bitcoin to around $150,000. We are currently at $109,000. The difference from today is so vast that an aircraft carrier could float past it:
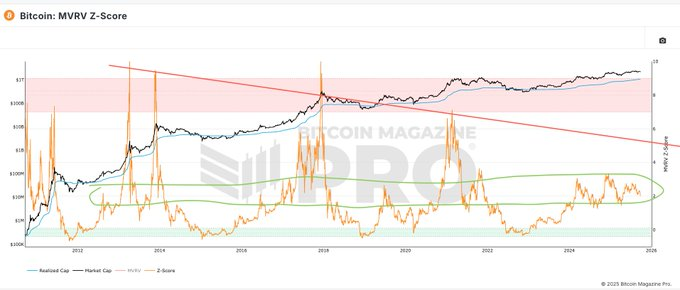
MRVZ
This indicator uses several criteria to identify market tops. While the current reading is slightly higher, it remains in "cycle noise territory," similar to the eerily elongated 2019 rally, and well short of the indicator's aggressively fitted trendline.
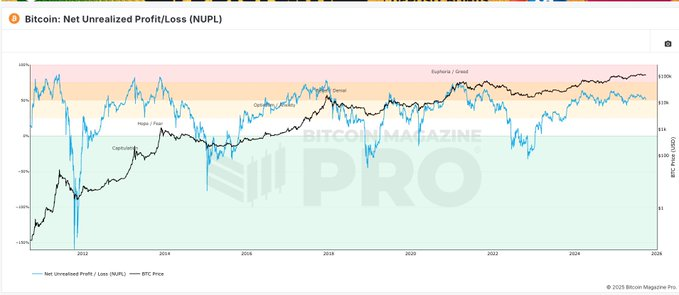
NUPL
This indicator doesn't have the same sense of diminishing returns: it measures the percentage of investors who are profitable. When nearly everyone is profitable, the market is on the brink of collapse. The previous cycle peaked at 75%, and this cycle's local highs are around 65%. Currently, it's around 50%.
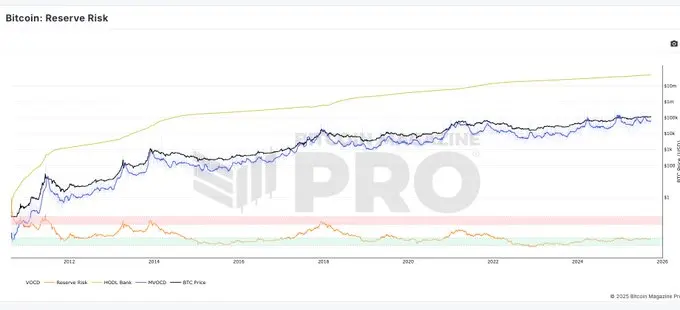
Bitcoin Reserve Risk
This indicator does a pretty good job of predicting local peaks. It successfully captured the turning points in March 2024 and January 2025, and even signaled a move in late July (before liquidity drastically contracted). But now, there's no movement.
Other on-chain indicators reflect basically the same situation.
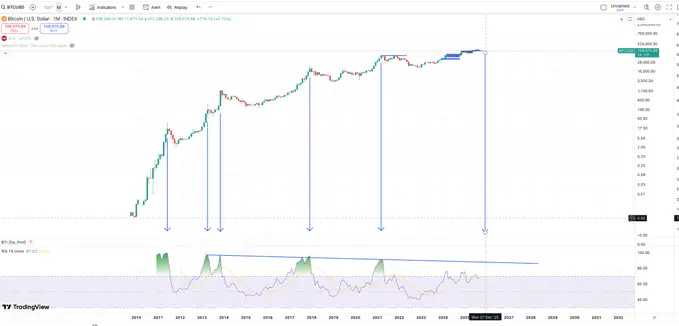
2) Monthly RSI indicator
Let's look at another reliable indicator from past cycles: the monthly RSI. Whether at the peak of a rally or during a distribution phase, this indicator always reaches this level at the end of a historical cycle. If it continues its fastest rise ever, the earliest it would reach this value would be around December:
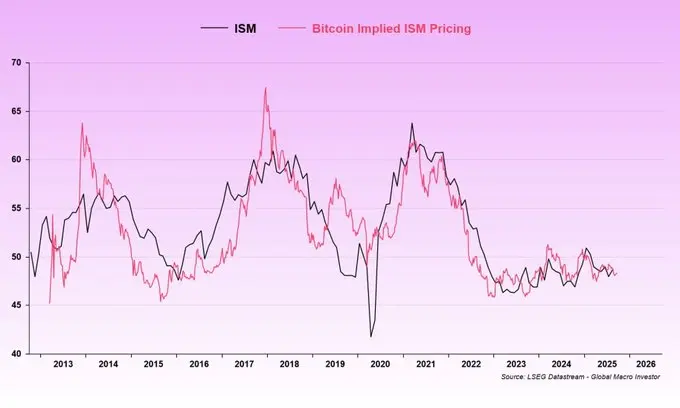
3) Business cycle correlation (Purchasing Managers Index PMI)
Macro analyst Julien Bittel deserves credit for frequently discussing this index. His view aligns perfectly with the notion that "this is a distorted, extended version of 2019, and we're just a few quarters behind the business cycle." While alternative sources of liquidity, a once-in-a-generation ETF cycle, and a frenzy of favorable regulatory news have fueled Bitcoin's significant gains to date, we haven't yet seen a peaking rally in the ISM index.
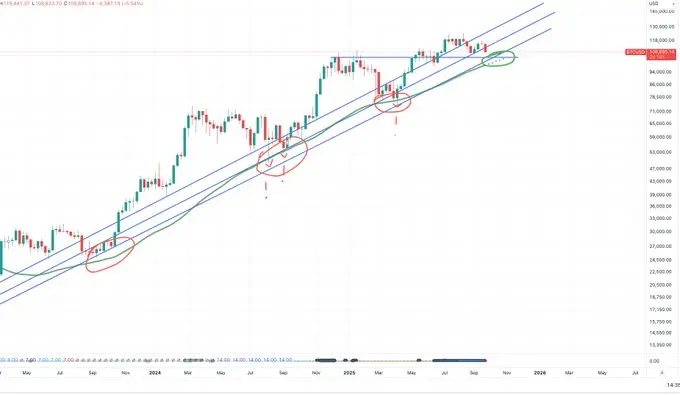
4) 50-week moving average support
Classic technical analysis generally holds that a crypto bull market ends only when the weekly close falls below the 50-week moving average. Bitcoin currently has approximately $10,000 to go before reaching this moving average. Without long-term market research and consistent record-keeping (or perhaps an exceptional memory), one might have forgotten that we've already tested this moving average twice, even experiencing multiple lower shadow penetrations. This moving average is currently trending upwards, poised to resonate with support between 98,000 and 104,000. This is a clear historical precedent.
5) Recent news headlines
Cryptocurrencies have experienced an unusually deep plunge, while the stock market continues to rise. We just received news that the SEC (yes, the same SEC that "legalized crime" during the Trump administration) is investigating over 200 DATs (cryptocurrency treasuries) for possible insider trading. These DATs appear somewhat frothy to me, which may explain the relative weakness in cryptocurrencies. While this could create a painful "band-aid" moment, given the distance from key support levels, prices may actually experience room for recovery.
6) "The charts showed signs of this already"
This pullback is “in the charts.” Unless we are in the final weeks of a parabolic rally, ETH (and altcoins) will always retest support here, causing Bitcoin’s market cap share to rise.
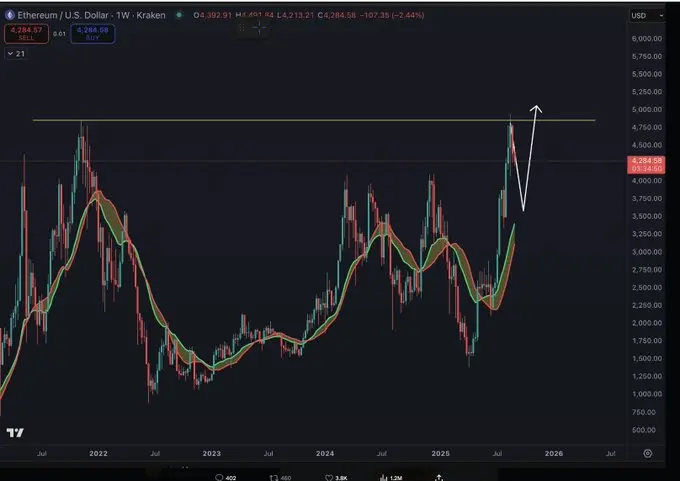
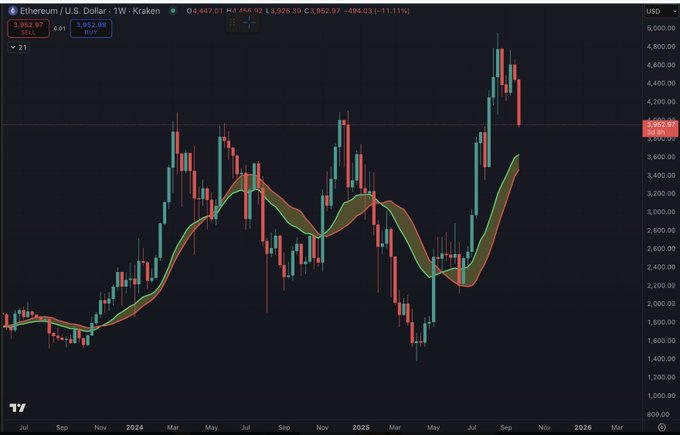
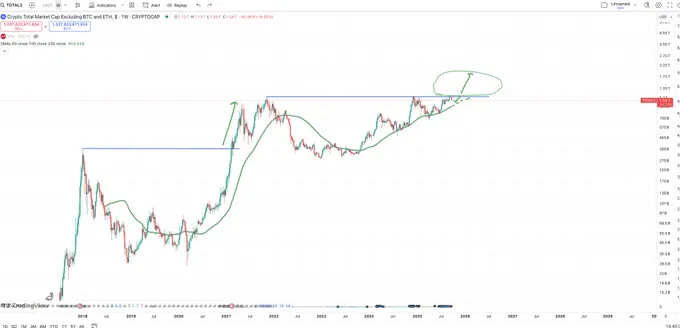
7) Total market capitalization of cryptocurrencies (excluding Bitcoin)
Total altcoin market capitalization has again clearly hit resistance at its previous all-time high, while Ethereum is also correcting from its highs. The 50-week moving average is steadily rising, and this appears to be a pullback to that level, with a breakout likely still months away. This is more of a bullish pattern than an "end of cycle" signal.
8) Social Media
The Coinbase App Store ranks outside the top 200, while Phantom and Moonshot are quite high. I’m not sure we really need retail investors to enter the market to reach the top, and I don’t think these apps need to break into the top three again (or even return to the top), but the current ranking is as cold as the back of Pluto.
At the same time, the viewing indicators of the YouTube channel are still at a bear market level, for reference only.
