
Author: On-Chain Mind
Compiled by Shaw Golden Finance
There's a quietly underway force reshaping the market's supply dynamics: Bitcoin exchange-traded funds (ETFs). These products already hold 7% of all Bitcoin in circulation, and if you're not paying attention, you're missing out on the most important piece of the puzzle.
In this article, we'll explore ETF flows in detail, dissect newly developed indicators at the forefront of fund flow analysis to help measure the impact of ETFs, and consider what these flows reveal about market dynamics and human behavior.
Let's get started.
Key Points at a Glance
- Absorbing large amounts of supply: Global Bitcoin ETFs currently hold over 1.4 million BTC, representing over 7% of the total supply, which has implications for scarcity and price stability.
- Money flow patterns and psychology: Daily and cumulative money flows reflect investor behavior, highlighting opportunities to buy during outflows and sell during inflows.
- Custom indicators for in-depth analysis: New tools such as Cumulative Flow Difference, Flow Volatility, and Flow-Weighted Average Price provide signals on market highs, lows, and investors’ cost basis.
- Long-term bullish outlook: ETFs are buying more Bitcoin than newly mined, a structural shift that could support future price increases.
A new era of Bitcoin adoption
Since their launch in January 2024, US exchange-traded funds (ETFs) have become a transformative force in the Bitcoin ecosystem. These financial products allow both retail investors and institutional giants to gain exposure to Bitcoin without directly holding it. Given that Bitcoin's supply is fixed at 21 million, this mechanism has a significant impact on Bitcoin's supply and demand dynamics.
However, it is estimated that approximately 3 million to 6 million Bitcoins are permanently lost due to loss of private keys, death of owners, or other irrecoverable circumstances. This reduces the actual number of Bitcoins in circulation to approximately 15 million to 18 million, which is the upper limit of the total supply of Bitcoin.
Against this backdrop, the fact that the ETF currently holds over 1.4 million BTC, equivalent to over 7% of the maximum supply, or potentially over 10% of the circulating supply, demonstrates just how significant its growing dominance is.
Quarterly and monthly updates
Let's first examine the health of ETFs in general.
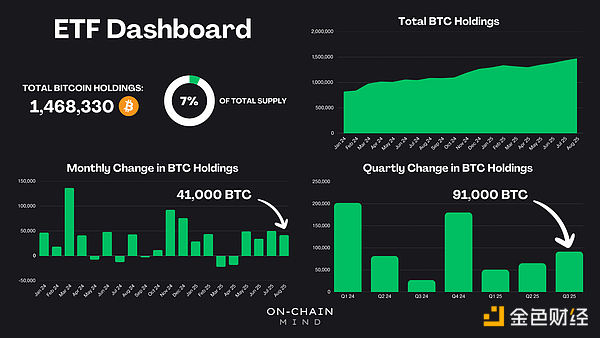
The total amount of BTC held by all Bitcoin ETFs globally has surpassed 1.4 million. Even before the end of the quarter, these ETFs have already absorbed over 91,000 BTC. This represents a strong quarter, surpassed only by the inflows seen during the initial ETF launches at the end of last year and the post-election rally.
The monthly breakdown of capital inflows is even more striking:
- May-August 2025: Continued inflows, steadily removing more Bitcoin from the market.
- In August alone, 41,000 BTC were absorbed.
- Bitcoins mined per day: About 450, or about 14,000 per month.
Simply put, ETF inflows this month have exceeded three times the new supply entering the system via miners. This absorption has put sustained upward pressure on prices by tightening available liquidity, perhaps explaining why we have had a passive and gradual climb to highs so far.
Capital Flow Analysis
Accumulated funds
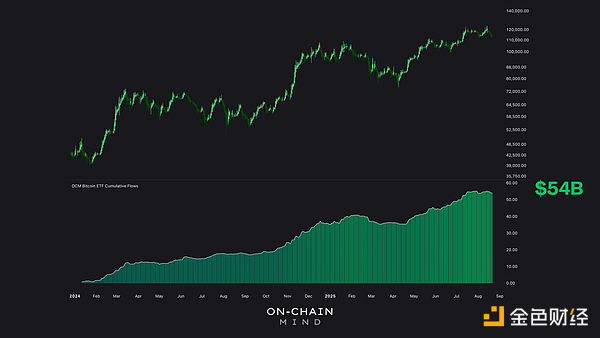
Looking at cumulative ETF flows, net inflows have reached a staggering $54 billion since January 2024. The overall trend is "continuously rising," with only brief pauses, indicating a continued influx of passive funds.
Cumulative flow difference
One of the most insightful custom indicators derived from this data is the Cumulative Flow Difference, an oscillator that measures the deviation of ETF flows from their long-term trend. This indicator accounts for these factors by shifting the values forward for non-trading days, such as weekends, and applies a 75-day moving average to smooth the data and reduce excessive noise. The Difference is the difference between daily flows and this average, highlighting any acceleration or deceleration in net flows.
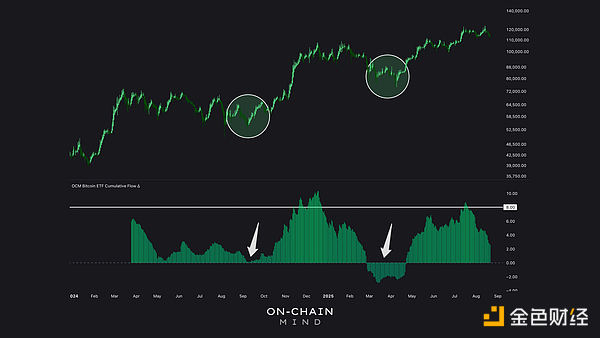
Data from March 2024 onwards shows that when the Cumulative Flow Difference is above +8, it indicates high prices, exceptional capital inflows, and buoyant market sentiment. A Cumulative Flow Difference close to zero or negative, however, marks a low point, potentially indicating undervalued investment opportunities. This metric effectively quantifies the behavior of retail investors and encourages contrarian trading.
Daily capital flow
A closer look at daily ETF flows reveals a correlation with Bitcoin's price action. Inflows dominate during rallies, while outflows surge during pullbacks. The correlation is clear: retail investors, who make up the bulk of ETF participants, exhibit rising and falling behavior. They flock in during highs driven by FOMO and flee during lows due to fear, uncertainty, and doubt.
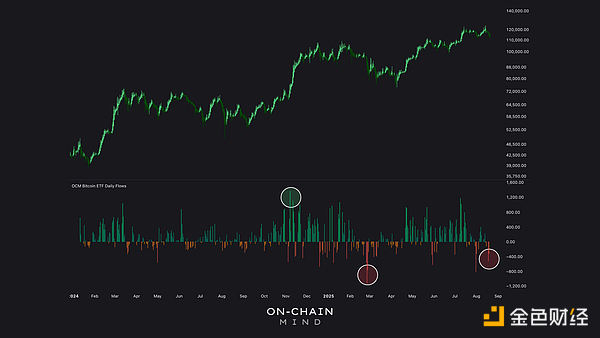
The largest outflow occurred in February 2025, when Bitcoin plummeted 17% from $100,000 to $83,000, triggering panic selling. Conversely, the largest inflow occurred in November 2024, during Bitcoin's rally from $70,000 to $90,000. These patterns are a real-time manifestation of behavioral finance principles, such as herd mentality and loss aversion.
From an educational perspective, these numbers
A reverse strategy is provided:
- Buy heavily on red trading days with large capital outflows.
- Reduce buying on green trading days when inflows surge.
It might be that simple.
Traffic volatility
Another layer of analysis I perform is flow volatility, which tracks how volatile daily flows are relative to their historical averages. The red areas in the chart below indicate high volatility, which typically coincides with large price swings.
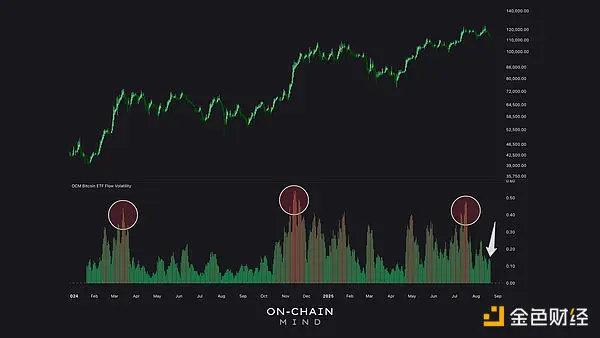
Interestingly, volatility has remained low throughout the recent decline from its all-time high of $10,000. This reflects Bitcoin's maturity: what were once "crashes" are now just regular fluctuations. Three to five years ago, a similar market move would have likely halved the price; now, with a market capitalization exceeding $2 trillion, such fluctuations are merely blips.
Traffic-weighted average price (FWAP)
Perhaps the most innovative metric is the Flow Weighted Average Price (FWAP), an experimental indicator that weights the price of Bitcoin by daily ETF flows. The metric calculates the price-flow product and the decreasing cumulative sum of flows, emphasizing recent activity to reflect market sentiment among current holders.
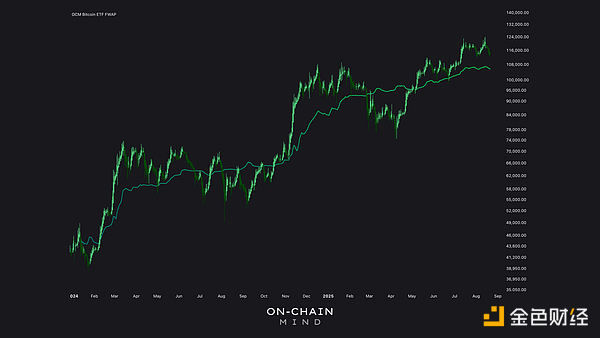
I’ve come to think of this as the ETF version of the “realized price” — a cornerstone of on-chain analytics that represents the average price of all tokens when they last changed hands. FWAP similarly attempts to estimate the average cost basis, but for ETF investors.
Currently, the average cost price is $105,000, which is similar to the price realized by short-term holders. This suggests that ETF holders are likely to be profitable even during this correction. Recent history shows that when prices fall below this level, panic selling occurs, marking a local bottom amidst extreme pessimism.
The potential of this indicator also extends to derivatives, such as FWAP-based oscillators and risk indicators, so I will be further refining those in the coming weeks. But even now, it provides a unique perspective on institutional/retail cost basis that I haven't found elsewhere.
Bullish signal of tightening supply
From a broader perspective, one thing is clear: ETFs are structurally absorbing Bitcoin supply at a rate far exceeding mining output, fundamentally reshaping the supply landscape. This "supply absorption" is bullish in the long term because it reduces the amount of Bitcoin available for spot trading.
But that doesn't mean it will only "go up forever." We can clearly see from fund flows that investors are also happy to sell their coins (or stocks) when prices fall. So this is something I will be watching closely.
The data also reveals some surprising insights. While exchange-traded funds (ETFs) have been quietly accumulating significant amounts of Bitcoin, money flow data offers a compelling window into human psychology. The emerging indicators discussed here represent the cutting edge of Bitcoin analysis based on money flow, and they will undoubtedly become key tools in my future accumulation strategies.
At the current rate, these ETFs and the indices that track them will only become more important as the market evolves.
