summary
- As the market rally cools and uncertainty grows, the tone in the crypto market has shifted from "greed" to "fear."
- Even so, mainstream crypto assets such as Ethereum and Solana have shown strong resilience.
- And is Chainlink, the day’s biggest performer, making a comeback?
Even as market sentiment has shifted toward “fear,” the crypto market appears to be entering a cautious rebound mode.
Yesterday, Bitcoin fell to just above $113,000, a 2% drop. Bulls are attempting to erase those losses today. Despite mixed signals from the broader market, a handful of risk-on assets are showing signs of strength: Ethereum, Solana, and DeFi stalwart Chainlink.
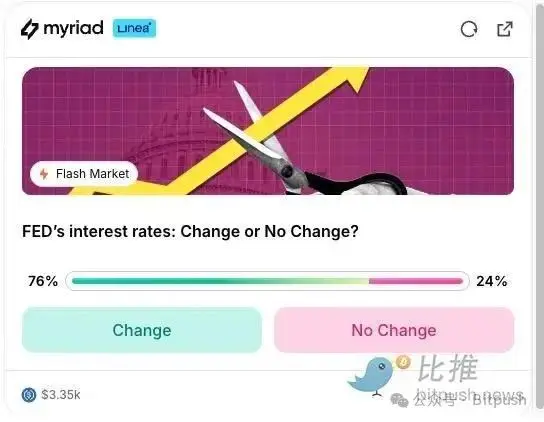
First, let’s look at the macro picture: The FOMC minutes and Fed Chairman Jerome Powell’s speech at Jackson Hole two days later may clarify the timing of a rate cut, which is keeping traders on their toes for now.
Uncertainty is being felt across the market: the S&P 500 fell nearly 1% today, and the Crypto Fear & Greed Index has seen a dramatic shift in just seven days. Last week, the crypto market was overwhelmingly in "greed" territory, with a score above 70 on a scale of 0 to 100. Now, the index has fallen to 44, a "fear" level, its lowest level since June.
Despite this, Ethereum (ETH), Solana (SOL), and Chainlink (LINK) are still attracting buyers.
Why? Let’s dig into the chart to analyze:
Ethereum (ETH): Resilience
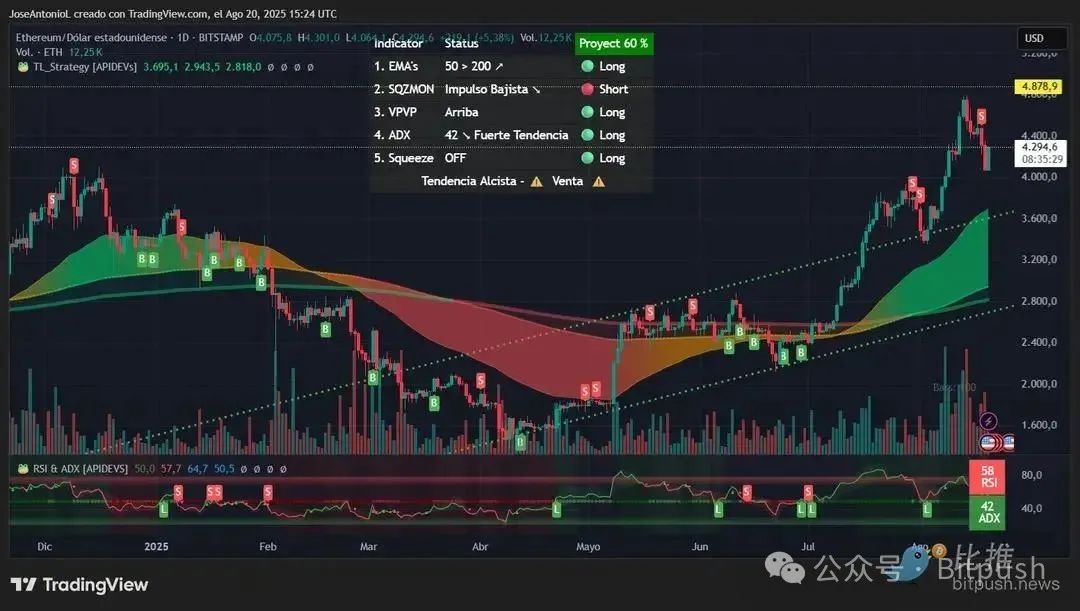
Long-term Ethereum holders will undoubtedly say it's resilient. The price of ETH opened near $4,000 today, a two-week low, but has since surged to over $4,300. Despite widespread market uncertainty, the intraday gain was as high as 7.37%.
Today's still-forming candlestick with a long body (formed by volume) appears poised to offset yesterday's decline. If confirmed, this type of bullish reversal after a downtrend typically indicates that buyers are aggressively defending support levels, which often foreshadows further gains.
While downward pressure persists, bulls and bears are engaged in a fierce battle within this price range. Bulls have garnered significant support thanks to significant purchases from Ethereum treasury companies like BitMine and Sharplink. On Monday, Tom Lee's BitMine announced an additional $1.7 billion worth of ETH, while Sharplink announced its $600 million purchase of Ethereum just yesterday.
That’s enough to keep traders on the Myriad prediction market bullish. Myriad users currently believe there’s a 74% chance that Ethereum will reach $5,000 by the end of the year, up from 66% yesterday.
Looking at the broader picture, the ETH chart shows a bullish trend that has been forming since late April. Yesterday’s sell signal could still see prices fall towards $3,600, but the overall bullish trajectory remains in place in the long term.
For traders, the Average Directional Index (ADX) provides a quick window into trend direction. The ADX measures the strength of a trend, regardless of direction, on a scale from 0 to 100. A reading above 25 indicates a well-established trend, while readings above 40 indicate very strong momentum. ETH's ADX is 42, indicating we're witnessing one of the strongest directional moves in recent months.
Traders would interpret this as a strong bullish signal, knowing that markets typically follow strong trends until the ADX peaks and begins moving in the opposite direction. This has not yet happened for ETH.
The exponential moving averages (EMAs) paint an equally compelling picture. Ethereum's 50-day EMA is well below the current price, at approximately $2,800. The 200-day EMA provides a base around $2,400. This wide divergence, known as a moving average divergence, typically occurs during sustained bull markets. When a short-term average is significantly above a long-term average, it indicates sustained buying pressure, often driven by institutional traders.
The Relative Strength Index (RSI) is currently at 58, placing it in what traders call the "Goldilocks zone"—not too hot, not too cold. The RSI measures momentum on a scale of 0 to 100, with readings above 70 indicating overbought conditions and often foreshadowing a pullback. An RSI of 58 suggests ETH has significant room to rise before reaching levels that typically trigger automated selling.
The Squeeze Momentum Indicator also suggests that the market has released volatility from the previous consolidation phase. This generally indicates that we are in an active trending phase rather than consolidation, which aligns perfectly with the high ADX reading.
Key price points:
- Immediate Support: $4,000 (psychological level and former resistance)
- Strong support: $3,600 (50-day EMA area)
- Immediate resistance: $4,400 (recent pullback area)
- Strong resistance: $4,878 (August high)
Solana (SOL): Shining against the trend
Ethereum’s biggest competitor, Solana, has also seen a rally this year, though the current charts don’t paint a similarly bullish picture.
Today's Solana price action suggests consolidation, with the cryptocurrency opening at $176.29 before jumping above $184. The 4.75% gain masked intraday volatility, with Solana erasing yesterday's losses. This pattern, especially after rebounding from $160, suggests indecision among both buyers and sellers, often signaling a pause before the next directional move.
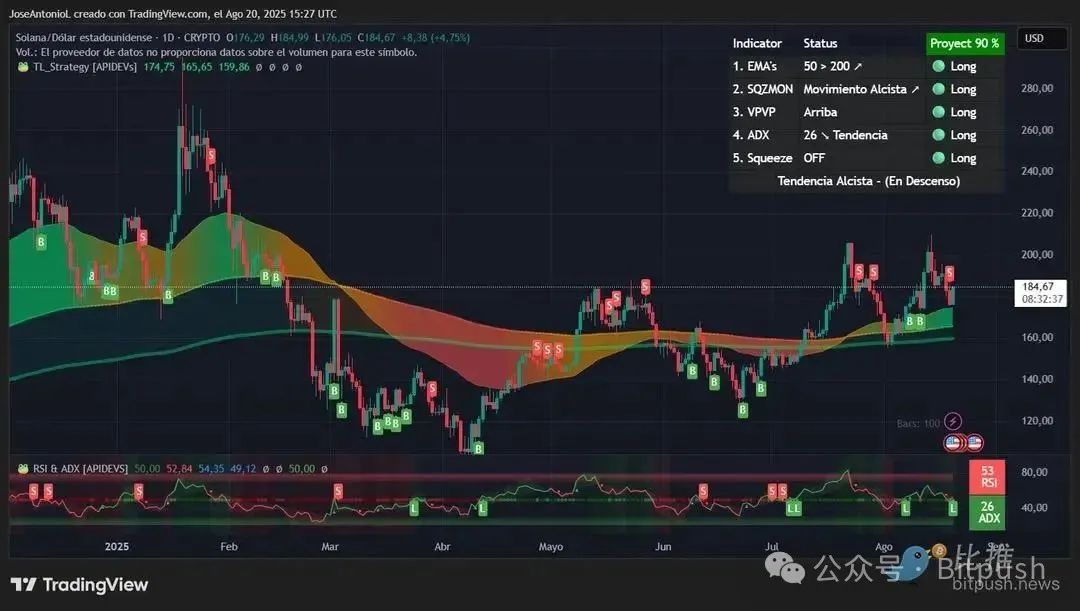
Looking at the broader pattern, many swing traders and most position traders will consider that Sol has been forming a classic "cup with handle" pattern since May. The "cup" formed from May to July, with a low near $105, while the current price consolidation between $175 and $195 forms the "handle." This bullish continuation pattern typically breaks out to the upside, with a target price of approximately $285 (adding the depth of the cup to the breakout point near $195).
However, looking at the shorter time frames that are more closely watched by day and swing traders, a "double top" pattern (an M shape where price fails to break above a weak resistance level) could indicate that prices may continue to fall for a few days.
It’s these conflicting signals that may be fueling bearish sentiment among traders on Myriad. Myriad users currently believe there’s only a 40% chance that Solana will reach a new all-time high of $294 this year. This is down from the near 50-50 odds seen last weekend.
Currently, Solana is holding key support levels despite facing competition from Ethereum's Layer-2 network, Base, in the memecoin space and the volume generated by such exchanges. An ADX reading of 26 confirms the establishment of a trend, but in this case, it's a very, very slow bullish trend with low volatility and relatively low returns.
The moving average configuration reveals an interesting battle. The 50-day EMA near $165 provides nearby support, while the 200-day EMA is located lower at $159. This relatively small price gap compared to ETH suggests that SOL is early in its trend development, with no clear advantage for either bulls or bears.
The RSI is 53, confirming neutral momentum – neither overbought nor oversold.
However, Solana's improving fundamentals may begin to attract the attention of more large institutional investors. A network of publicly listed treasuries has begun to form around Solana, but not to the same extent as Bitcoin and Ethereum. Earlier this month, the largest SOL treasury, DeFi Development Corp, purchased approximately $18 million worth of SOL, bringing its total holdings to over $200 million.
Solana’s proposed Alpenglow upgrade, expected to launch later this year, aims to make this already fast network even faster, which is also worth considering in terms of future network usage and demand for Solana.
Key price points:
- Immediate Support: $175 (recent consolidation low)
- Strong Support: $165 (50-day EMA)
- Immediate Resistance: $195 (psychological level)
- Strong resistance: $209 (August high)
Chainlink (LINK): Bulls Return
Most of you are probably familiar with the XRP bulls, but you may not have heard of the Link bulls – these equally vociferous Chainlink advocates are lesser-known.
At one point, even Dave Portnoy, the founder of Barstool Sports, was a member. But Chainlink has lost some of its popularity in recent years, having hit an all-time high of over $52 four years ago.
So it might be a bit surprising that Link might be experiencing a comeback right now. Chainlink, an oracle platform that provides pricing data for nearly every DeFi application, is currently doing something that even the aforementioned major crypto assets can't: it's up 152% over the past year, 31% over the past 30 days, 53% over the past two weeks, and even saw a respectable double-digit gain today.
It is this strong intraday gain that sends a strong bullish signal for Chainlink and its Link bulls at a time when the entire market is retreating in “fear.”
LINK opened today at $23.50 and subsequently surged to over $26, achieving an impressive 10.77% gain, completely erasing yesterday’s losses.
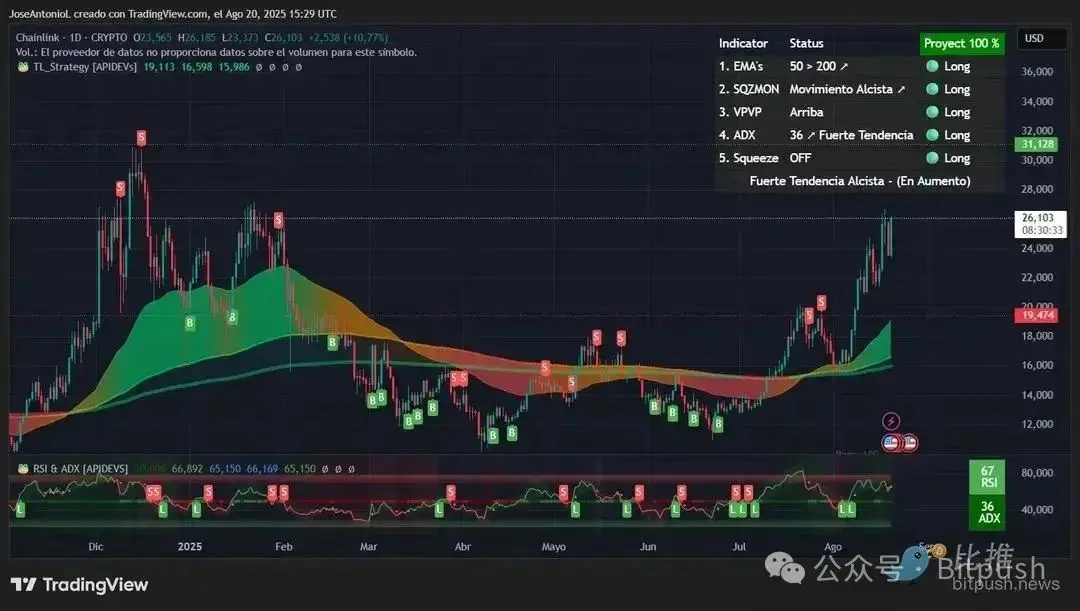
The candlestick shows a large green body with almost no wicks – a textbook bullish engulfing pattern. This pattern, where today’s green candlestick completely “engulfs” the previous day’s red candlestick, is a strong reversal signal in technical analysis.
The broader chart shows that LINK has been forming a massive “rounding bottom pattern” (also known as a saucer bottom) since the December 2024 low near $10.50. This pattern continued throughout the first half of 2025, with a breakout above $16 in July confirming its completion.
The subsequent rally to $26 in early August represented the initial push from this base, while the current pullback to the $19 area appears to be a healthy retest of the breakout zone. Today's bullish engulfing candlestick at this key support level suggests the retest is complete, and LINK may be ready for the next leg up, with the pattern's measured target pointing towards $31.
The ADX is 36, indicating a "strong trend," well above the confirmation level of 25 but below the extreme readings above 40 that typically signal trend exhaustion.
Traders may also consider that the moving averages appear bullish. The 50-day EMA provides support near $19.10, while the 200-day EMA is located near $16.80. LINK is trading above both moving averages and is expanding the distance between them, which confirms the bullish market structure.
The RSI is at 67, approaching but not yet breaking the overbought threshold of 70. This is crucial, as algorithmic trading systems that use the RSI as a reference may trigger sell-offs when the indicator rises above 70. LINK has proven in the past that it can maintain RSI readings between 65-75 during bull runs without an immediate pullback, suggesting that its bulls still have momentum to move forward.
Key price points:
- Immediate Support: $21 (psychological level)
- Strong Support: $19 (50-day EMA)
- Immediate resistance: $27 (round resistance level)
- Strong resistance: $31 (December 2024 high)
This article is translated from Decrypt, the original author is Jose Antonio Lanz, Guillermo Jimenez.