
Author: ltrd
Compiled by: Block unicorn
All consistently profitable traders know that unbiased, emotionless decision-making is key to a sustainable trading career. You must think outside the box and constantly reassess risk-reward and the likelihood of adverse choices. This is why a well-structured research process is crucial for every successful trader.
But why am I speaking to you this way — and why am I calling this article “Is Binance Evil?”
The reason is simple. Over the past few weeks, I've witnessed a surge of strong sentiment surrounding Binance and other exchanges. While some of the arguments against exchanges (particularly Binance) are certainly valid, I kept seeing biased reasoning and conclusions, so I decided to conduct a simple, transparent study based on a single hypothesis:
H₀: “Binance is evil and a negative for projects listed on the exchange.”
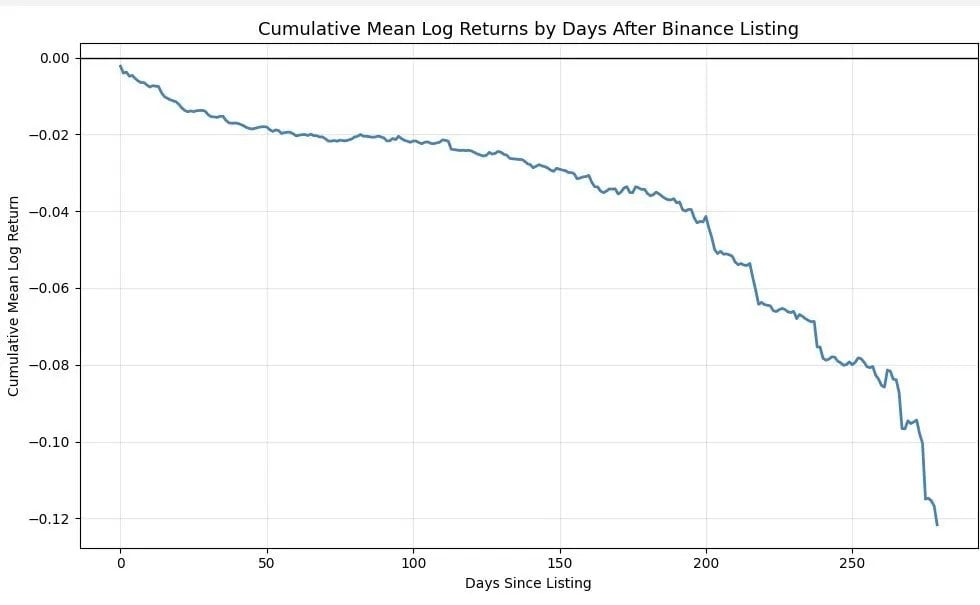
The first thing that inspired me to do this research was a post by Scott Phillips (I actually love your posts and your way of thinking—nothing personal here, I hope you'll forgive me). He published a beautiful chart showing the average price trend of all cryptocurrencies over the first 300 days after Binance launched. There's nothing wrong with the chart itself—I like the analysis—but one thing that bothered me was the statement: "Binance is a cancer in the industry."
I just don't see any connection between the data in the chart and this conclusion.
Imagine you walked into my office (and many people do this every day) and told me, “Tom, look at this chart — Binance is the cancer of this industry.”
You better have backed up everything on your work laptop, because you're never going to touch it again. This post isn't really about Binance—it's about testing a hypothesis and figuring it out. It's about methodological integrity and convincing people that your hypothesis is valid.
Before we begin, I'd like you to critique my arguments through your analysis. This is exactly what we do in research sessions. I won't be offended—I'm so used to constructive criticism that I don't even care; I just want to make sure my analysis is sound so I can learn from it. Your only goal is to go through it carefully and point out every possible flaw in my reasoning. I'm not here to prove that Binance isn't evil. I'm just trying to verify that this hypothesis is true.
When I see this type of chart, I always think: there’s a random correction missing here.
What does this mean? It means I want to look at random listings from other similar exchanges and subtract those results from the Binance dataset. This is how you remove bias. In our case, it's not actually random because we can easily calculate all the factors associated with listings on other exchanges. Typically, in high-frequency trading, you can't "calculate everything," so I call this a random correction.
When you conduct your research, you need to clearly state your hypothesis:
- I selected all products listed on Binance (spot market) starting from January 1, 2022. Why did I choose this date? Because I didn’t want to introduce confirmation bias by selecting data from 2020 to 2021, as I already knew the results would be significantly skewed towards the positive side and not representative of the current market.
- I only included USDT trading pairs.
- I only selected products that have been traded for more than 90 days.
- I excluded the first day (that's why all graphs start at 0).
Why? Because exchanges handle market openings differently. Some exchanges artificially create a first order well below fair value, just to make the chart appear to have a large surge upon listing—a completely spurious phenomenon. Other exchanges announce listings long before or immediately upon listing, making it impossible to effectively isolate the announcement effect.
Removing the first day can make the analysis clearer and more comparable. Of course, you can also come up with your own approach.
After completing the analysis, I obtained the following results:
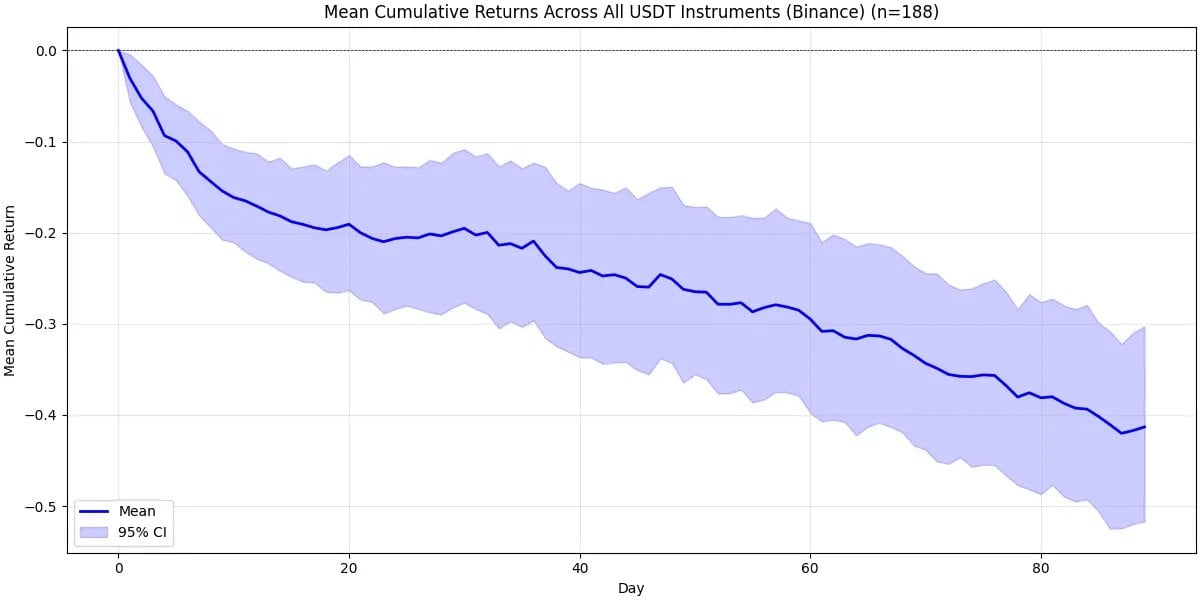
This is the cumulative return of all tokens that met my criteria in their first 90 days after listing on Binance's spot markets. What do we see? There was massive—absolutely massive—selling pressure from the start. After a few days, things stabilized a bit, and then we entered a steady downtrend. Why did this happen? Partly due to the overall cryptocurrency market trend. On average, tokens tend to move downward after listing. Furthermore, I selected all tokens that were listed after January 1, 2022, which was right after the bull run, so the overall environment wasn't very favorable.
Now, let's address my biggest concern—the lack of random correction. To me, there's no real research without random correction. Even if you showed me your last 100 runs, with an average of 10.50, I couldn't judge unless I saw how it compared to the overall market. Without a benchmark, there's no judgment.
In this case, "the overall market" should refer to other comparable exchanges - such as Coinbase and Bybit. Therefore, in order to do this correctly, we need to perform the exact same calculation (under the same conditions) for Bybit and Coinbase. Let's take a look at the chart below.
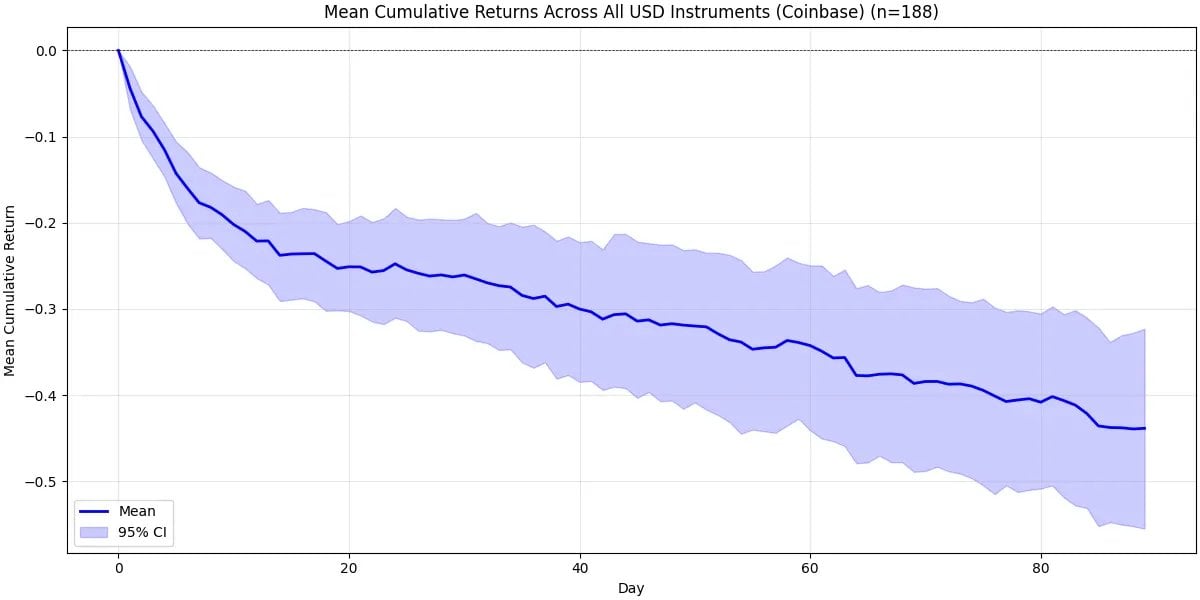
As you can see, the Coinbase chart looks much worse than the Binance one. About 20 days after listing, the expected return drops to around -25% (and the upper confidence interval is still around -20%!). After that, we see the same pattern again—a brief period of stability followed by a slow downtrend, just like on Binance.
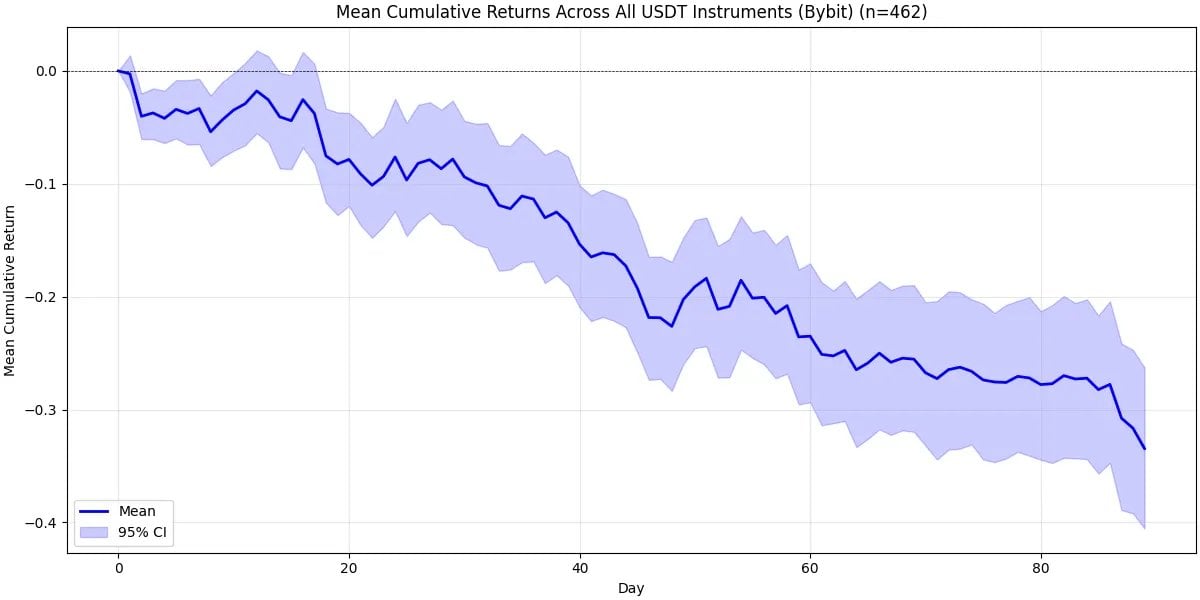
The situation with Bybit is slightly different. After 90 days, expected returns still drop significantly, but the initial selling pressure isn't as strong. Based on both data and intuition, I believe Coinbase is much more comparable to Binance than Bybit.
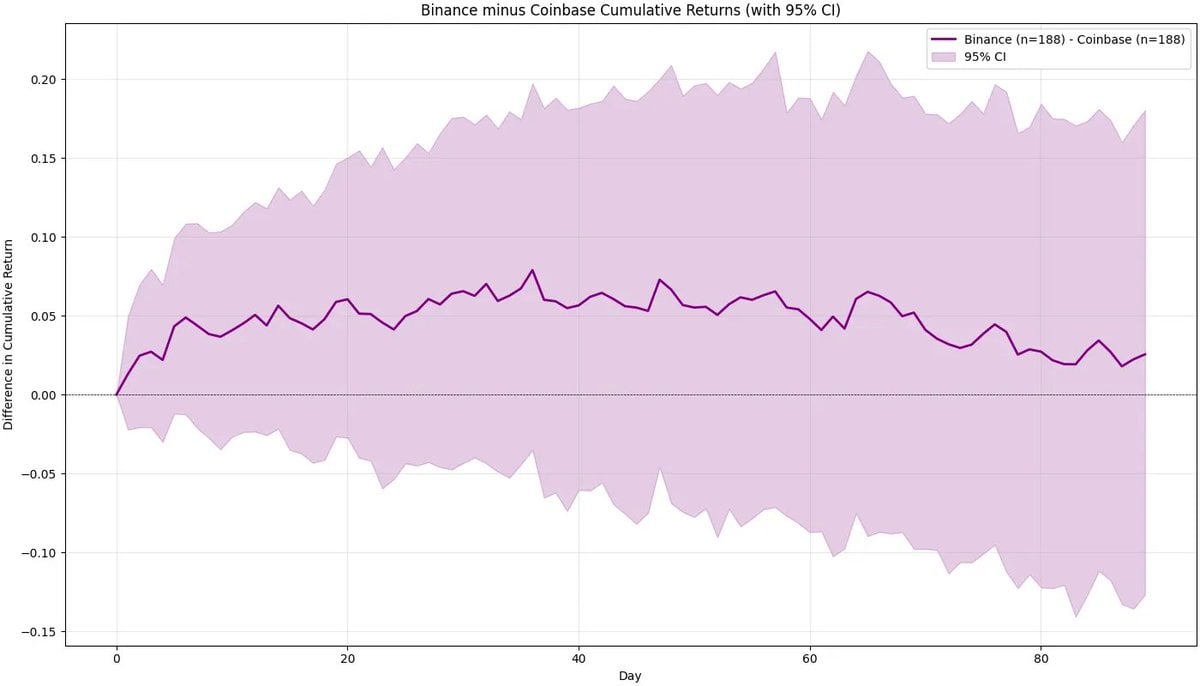
Now, let's actually compare these exchanges to Binance. To correct for randomness, simply subtract the above results from the main analysis of Binance. The chart below shows this. Intuitively, we now have the net impact of Binance when benchmarked against each exchange (Bybit/Coinbase).
You can clearly see—especially in the case of Coinbase—that Binance's impact is positive, not negative. Selling pressure on Coinbase is much greater than on Binance. Of course, once confidence intervals are factored in, this difference isn't statistically significant at the 95% confidence level—but the conclusion is still pretty clear: Binance-listed coins outperformed Coinbase-listed coins.
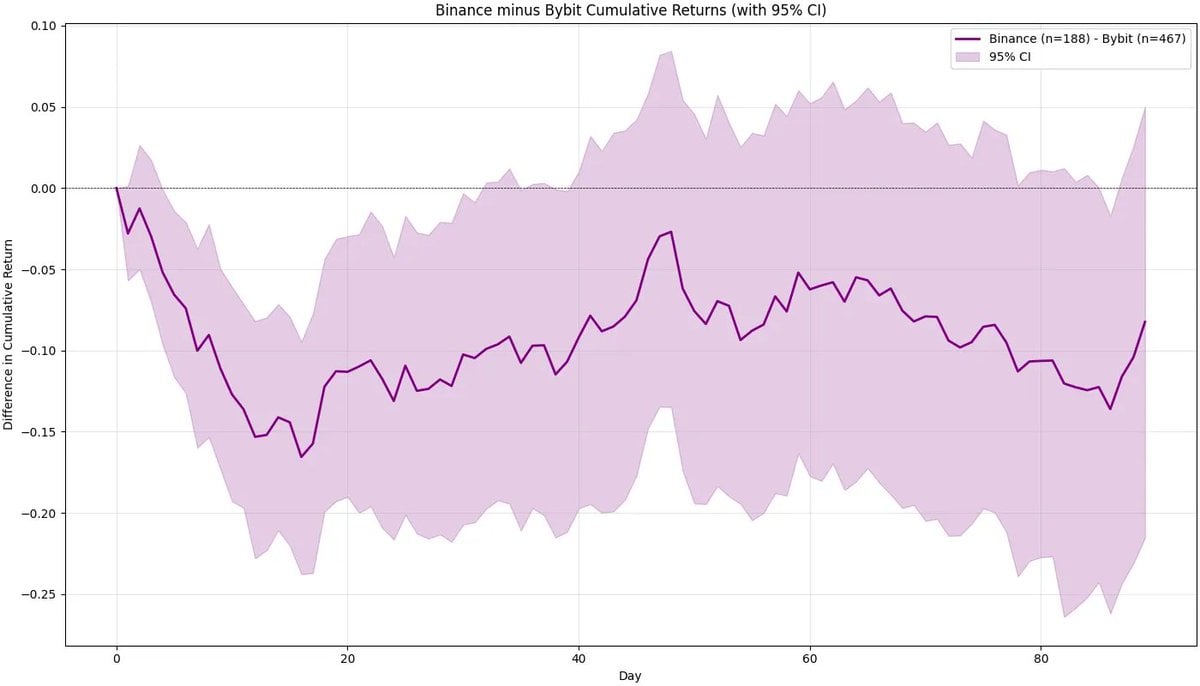
For Bybit, we can see that it performed significantly better in the first few days after listing. However, the difference quickly widened, and while we can say that Bybit outperformed Binance in the short term, the effect was not particularly significant.
After random correction, we absolutely cannot conclude that Binance is “evil” compared to other exchanges (especially Coinbase), as projects listed on Coinbase perform significantly worse. Now, let’s talk about an important thing - something we don’t discuss enough.
The curse of becoming the ultimate goal
Imagine you're communicating with a project team that hasn't even launched yet. What would you expect to hear from them? The answer will almost always be something like this:
“Our ultimate goal is to be listed on Binance (or Coinbase, or Upbit).”
This statement is crucial when we discuss the impact of a Binance listing on a project. Everyone is waiting for this moment. If you're a major investor or project founder and you truly believe you'll eventually list on Binance, Coinbase, or Upbit, what incentive do you have to sell your tokens after the Bybit listing? I'd argue it's practically zero—except for some operating expenses that force you to sell a small portion of your tokens.
This is why you see significant selling pressure on Binance and Coinbase, while Bybit experiences almost no selling pressure (and possibly none on Bitget, KuCoin, or Gate). However, according to our methodology, even after factoring out the announcement date effect, Binance's listing performance outperforms Coinbase's. Now, the question I'm sure to ask you is:
“What percentage of tokens would you estimate a typical large investor or founder would want to sell after the ultimate goal is to go public?”
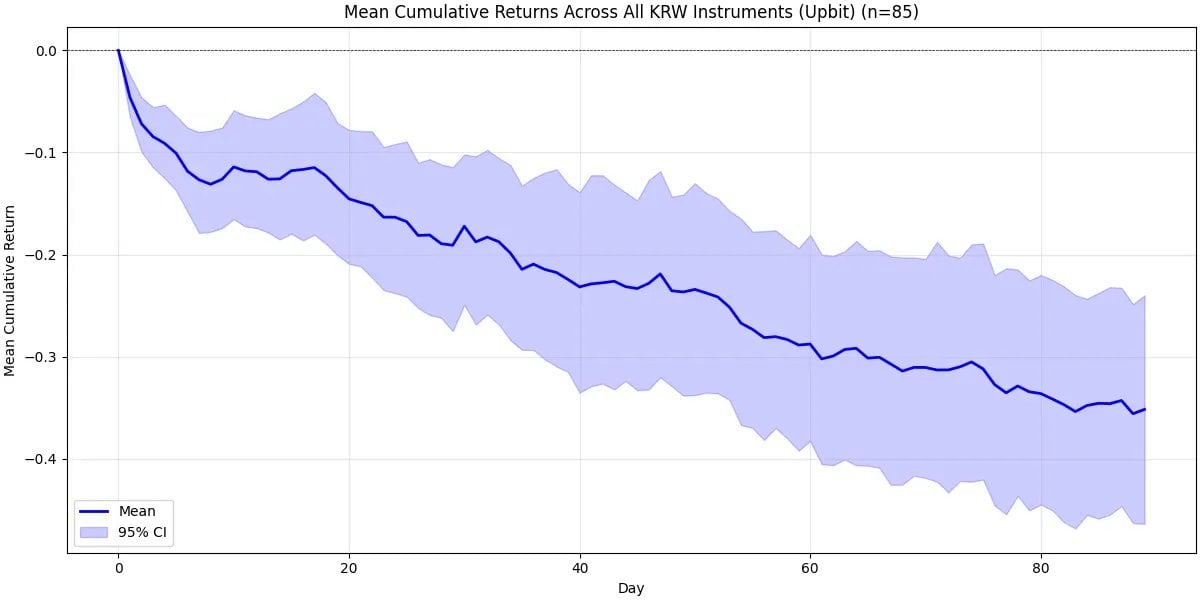
We can't answer this question directly—there's no clear data available. But you should at least have an estimate in mind, think about the logic, and then come up with a number. I mentioned earlier that Upbit is also an "ultimate" exchange, and people like listing in South Korea. Unfortunately, we still see strong selling pressure after the listing date. This is almost always a final outcome for projects—perhaps not as severe as Binance, but still significant—and you can clearly see this in the data. The chart below shows Upbit's performance and the difference between Binance and Upbit.
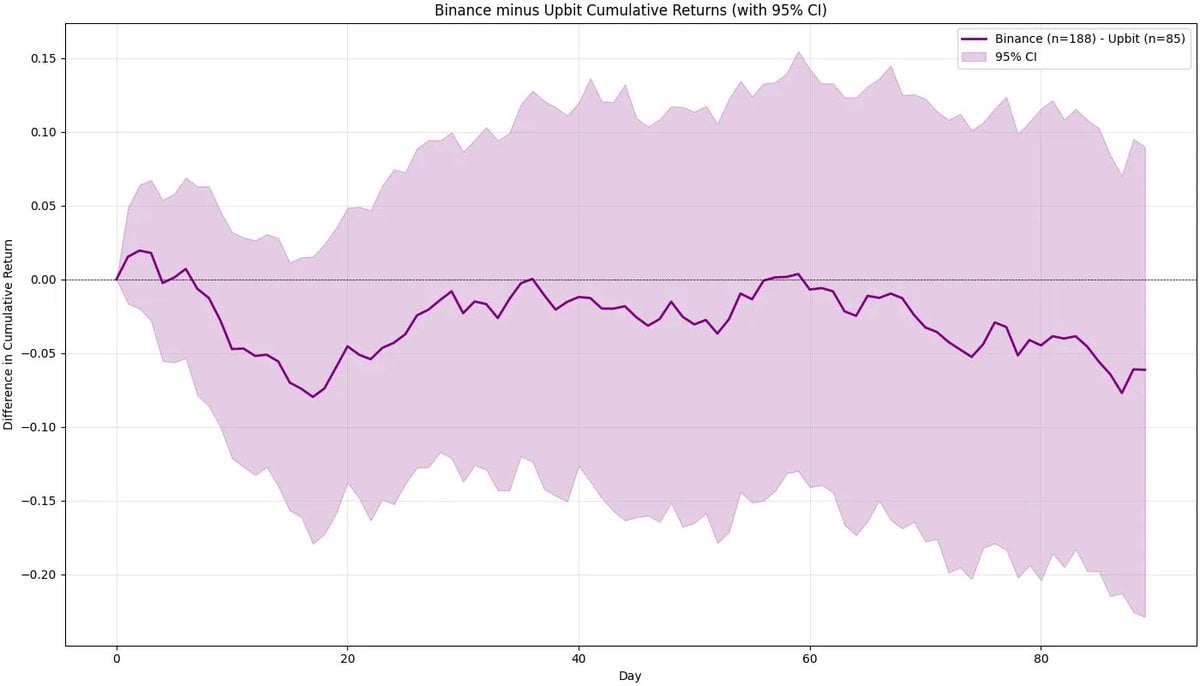
After 90 days, Upbit slightly outperformed Binance, but the difference is so significant that we cannot reasonably claim that Upbit is the better listing platform. In both cases, we saw strong selling pressure - which is actually completely logical if you think about it deeply.
How to price liquidity?
There is one thing that almost no one has considered.
After listing on Binance, liquidity far surpasses any other exchange. Binance allows founders and investors to partially liquidate their positions as needed, or to increase their holdings on a larger scale when a buyback is needed (honestly, I hope this happens more often). So, how should projects or investors price this significant increase in liquidity?
This is something that (almost) only Binance can offer — and it’s definitely something that every participant in this market should be willing to pay for, directly or indirectly.
We all want deep liquidity and the ability to go short or long perpetual contracts (of course, our analysis here is focused on spot exchanges, not perpetual contracts, but it’s an important feature worth mentioning).
A simple way to test Binance’s liquidity advantage
I’ve been thinking about a simple way to test whether Binance’s liquidity is truly superior to other exchanges without introducing significant biases. Here are my ideas:
- Find tokens listed on Bybit and Coinbase.
- Find tokens listed on Binance, but only after they have been listed on Bybit and Coinbase (ideally as much time as possible).
- Compare the liquidity of Binance, Bybit, and Coinbase a few days after Binance listing.
In this setting, Bybit and Coinbase have mature markets, while Binance is an emerging market. If Binance's liquidity is still significantly better than other platforms, we can confidently say that the liquidity surplus brought about by Binance's listing is real and substantial.
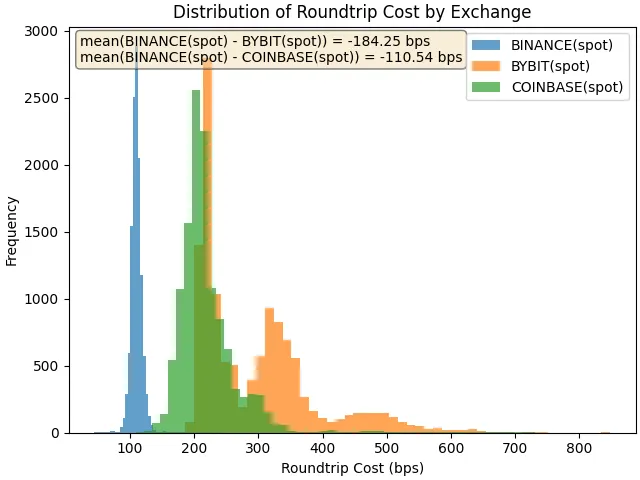
This chart shows the distribution of round-trip costs—the cost of executing a $100,000 market buy and a $100,000 market sell. Higher costs indicate lower liquidity. For token LA, which launched on Binance over a month after Bybit and Coinbase, we found that after five days, round-trip costs on Binance were 184 basis points lower than on Bybit and 110 basis points lower than on Coinbase.
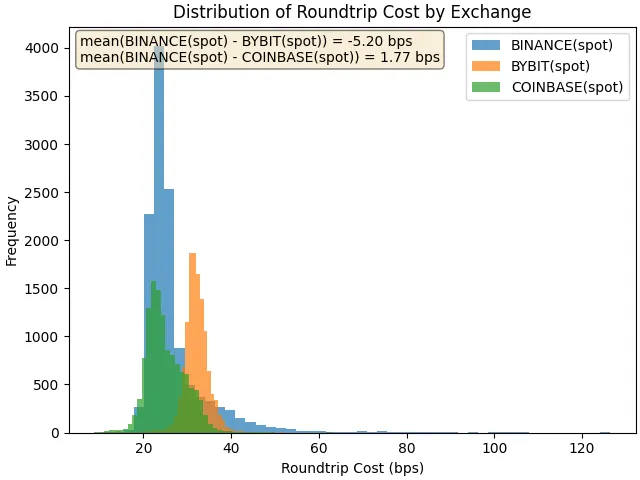
For ONDO, the round-trip costs between Binance and Coinbase are roughly similar – with a slight advantage in Coinbase (only a 1.77 basis point difference, likely due to differences in tick sizes).
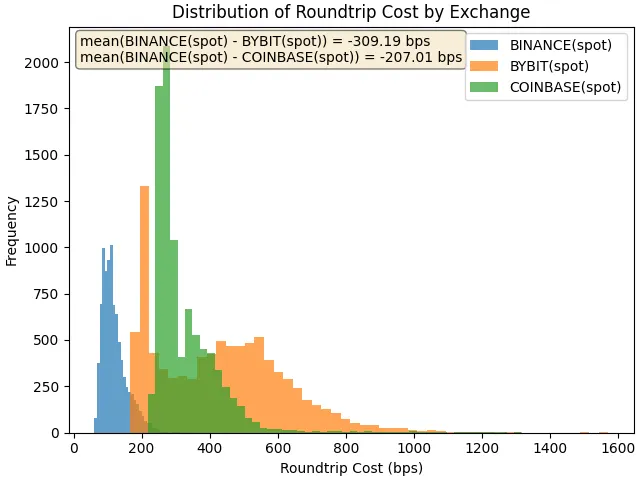
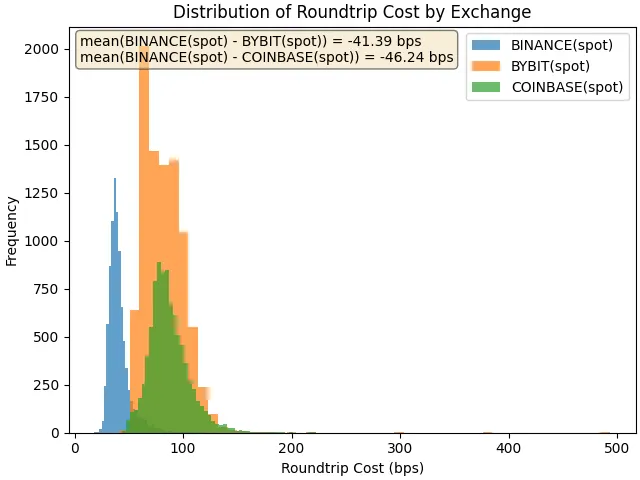
Now let's look at the less liquid product, AXL. Here, the cost differences are enormous. For a $100,000 trade, the cost difference is 309 basis points compared to Bybit and 207 basis points compared to Coinbase. For a $20,000 trade, the cost differences are still 41 basis points and 46 basis points, respectively. From the perspective of any current or potential holder, these figures are staggering.
What's next?
This is obviously not the only way to approach this topic - but it is a biased starting point. If we want to explore further, here are some open questions (which I won't answer now - time, as always, is limited):
- How should we contextualize broader market trends and how they relate to listing performance?
- How can we quantify announcement effects and incorporate them into our analysis?
- How should we weigh individual cases? Is ONDO more important than AXL? If so, by what metric (perhaps market capitalization)?
- Should we make the analysis more robust—for example, by winsorizing outliers?
- If we exclude BSC tokens from the Binance data, will the results change significantly?
We can keep asking questions like this forever—that’s the beauty of research.
There's always room for improvement, but ultimately, creativity and research ethics are more important than any specific model. Conducting nearly unbiased research will get you further than any machine learning approach. It's always about your ideas, your data preparation, and your culture of reasoning.
Conclusion
We’re not just here to talk about research, we’re here to talk about Binance.
Whether you consider Binance to be "evil" or "a cancer on the industry" is entirely up to you. Please examine yourself critically. Don't let bias and emotion constrain you. Because that's not where the money is made.
