
Author: 0xBrooker
The first contact between the United States and China in Switzerland achieved significant results, marking a major progress in the third phase of the "reciprocal tariff war."
The U.S. stock and crypto markets quickly cleared the negative pricing of the "reciprocal tariff war" at a speed and magnitude beyond expectations.
Market traders began to trade in a new paradigm - a game between whether the U.S. economy and employment will enter a recession and whether the Federal Reserve will appropriately restart interest rate cuts.
Inflation and employment data released this week showed that inflation continued to decline and employment was temporarily stable - the impact of reciprocal tariffs was lower than expected.
After the unexpected data was input into the new trading framework, the U.S. stock index rose sharply during the week and gold fell sharply.
This week, Federal Reserve Chairman Powell mentioned in his important speech that he would review the "monetary policy framework" and promote a rapid restart of the interest rate cut cycle. However, Fitch's rating of US Treasury bonds was adjusted from Aaa to Aa1, which once again showed that the long-term crisis of US Treasury bonds is still looming over the horizon.
Policy, macro-finance and economic data
The "reciprocal tariff war", the biggest variable in the financial market in the past few months, changed significantly on May 12. The United States and China announced a 90-day temporary tariff reduction agreement after contact in Switzerland. The United States will reduce tariffs on Chinese goods from a maximum of 145% to 30%, including a 20% "fentanyl tariff" and a 10% basic tariff. China will reduce tariffs on U.S. goods from a maximum of 125% to 10%, and suspend or cancel non-tariff countermeasures implemented since April, such as rare earth export restrictions.
Previously, we pointed out that the tariff war has entered the third phase . The preliminary agreement between the United States and China means that the third phase has made significant progress. Combined with Trump's subsequent announcement that he could not negotiate with 150 countries one by one, we tend to judge that the impact of the tariff war is gradually passing, and the final result may not have an unexpected impact on the global economy in the short term.
This should be the reason why US stock traders went long all week and quickly pushed up the three major stock indexes. For the whole week, the Nasdaq, S&P 500 and Dow Jones index rose by 7.15%, 5.27% and 3.41% respectively, and all three major stock indexes have achieved four consecutive weeks of gains. If the expectation of interest rate cut increases, it may break through the previous historical high in the short term.
This week, the US released CPI data for April, with a seasonally adjusted monthly rate of 2.3%, lower than expected, and a three-month decline. The employment data released on the 15th showed that the number of first-time unemployment claims was 229,000, in line with expectations. The PPI, which shows corporate trends, was 2.4%, slightly lower than expected. The combination of multiple data shows that the tariff war has not yet caused hard data damage to consumption. With inflation falling, restarting interest rate cuts is becoming the best option.
Powell said in a speech this week that the monetary policy framework introduced in 2020 (centered on a 2% average inflation target, allowing for moderate inflation overshoot to support employment) is no longer fully applicable in the current economic environment. He mentioned that frequent supply shocks (such as tariff wars and supply chain problems) make it difficult to cope with the average inflation target system, and policies need to be adjusted to better balance inflation and employment goals. In the framework used by the Federal Reserve in the past few years, it often pursues taking action when the CPI average over the past period is close to 2%. The review mentioned this time may prompt it to take action based on CPI data for a shorter period of time or even a single month. This will undoubtedly increase its flexibility to cope with data fluctuations caused by frequent policy adjustments by the Trump administration. According to the new framework, the current CPI data is already very close to its interest rate cut requirements.
There may be a deeper reason behind the Fed's reaffirmation of its monetary policy framework, which is the U.S. debt problem. With the rise of U.S. stocks, the 2-year and 10-year U.S. Treasury yields rebounded again this week to reach highs of 4.0140 and 4.4840.
According to analysis, the United States has added $1.9 trillion in debt this year, and the amount of debt due for replacement this year may reach $9.2 trillion, of which $6.5 trillion will be in June alone. If interest rate cuts are not initiated soon, not only will the US government continue to bear high interest, but it may also face auction difficulties in the primary market. As a "gray rhino", huge debts will continue to plague the US government and become the most important variable affecting its political, economic and financial policies. We believe that the fundamental reason for the Fed's adjustment of its monetary framework is debt and the potential crisis caused by debt.
On May 16, rating agency Moody's downgraded the U.S. government's long-term issuer and senior unsecured debt rating from Aaa to Aa1. This is the first time Moody's has downgraded the U.S. Treasury rating since 1917, and it also marks the loss of the highest credit rating of the three major rating agencies (S&P, Fitch, and Moody's) for the United States. Previously, S&P had downgraded the U.S. rating to AA+ (similar to Aa1) in 2011 and Fitch in 2023.
The debt "gray rhino" has become the most important indicator affecting U.S. interest rates and financial market stability in the medium and long term.
Crypto Market
Previously, BTC led the U.S. stock market in completing the pricing of the "reciprocal tariff war" and approached the previous high. After the sharp rise in the U.S. stock market this week, it maintained a high consolidation for most of the time, and suddenly rose to US$106,692.97 on Sunday, and finally closed up 2.24% for the week.
In terms of technical indicators, the market has been running above the "first rising trend line" for the whole week, approaching the upper edge of the "Trump bottom". The overbought indicator has been repaired to a certain extent. The volume is almost the same as last week.
Funds In and Out
The entire market maintained relatively strong capital inflows this week, with $2.527 billion flowing into the two channels, including $1.88 billion in stablecoins and $647 million in total for BTC ETF and ETH ETF.
ETF channel inflows have been declining for four weeks, which is worth noting.
The on-site lending funds are in the expansion stage. The contract market is in the second expansion stage of this round of market.
Selling pressure and selling
After returning to $100,000, some bargain-hunting funds took profit. As liquidity recovered, some long-term investors sold a small amount. Overall, the stage of "long-term investors reducing their holdings and short-term investors increasing their holdings" has not been fully opened, and long-term buyers who have experienced more pressure are expecting higher prices.
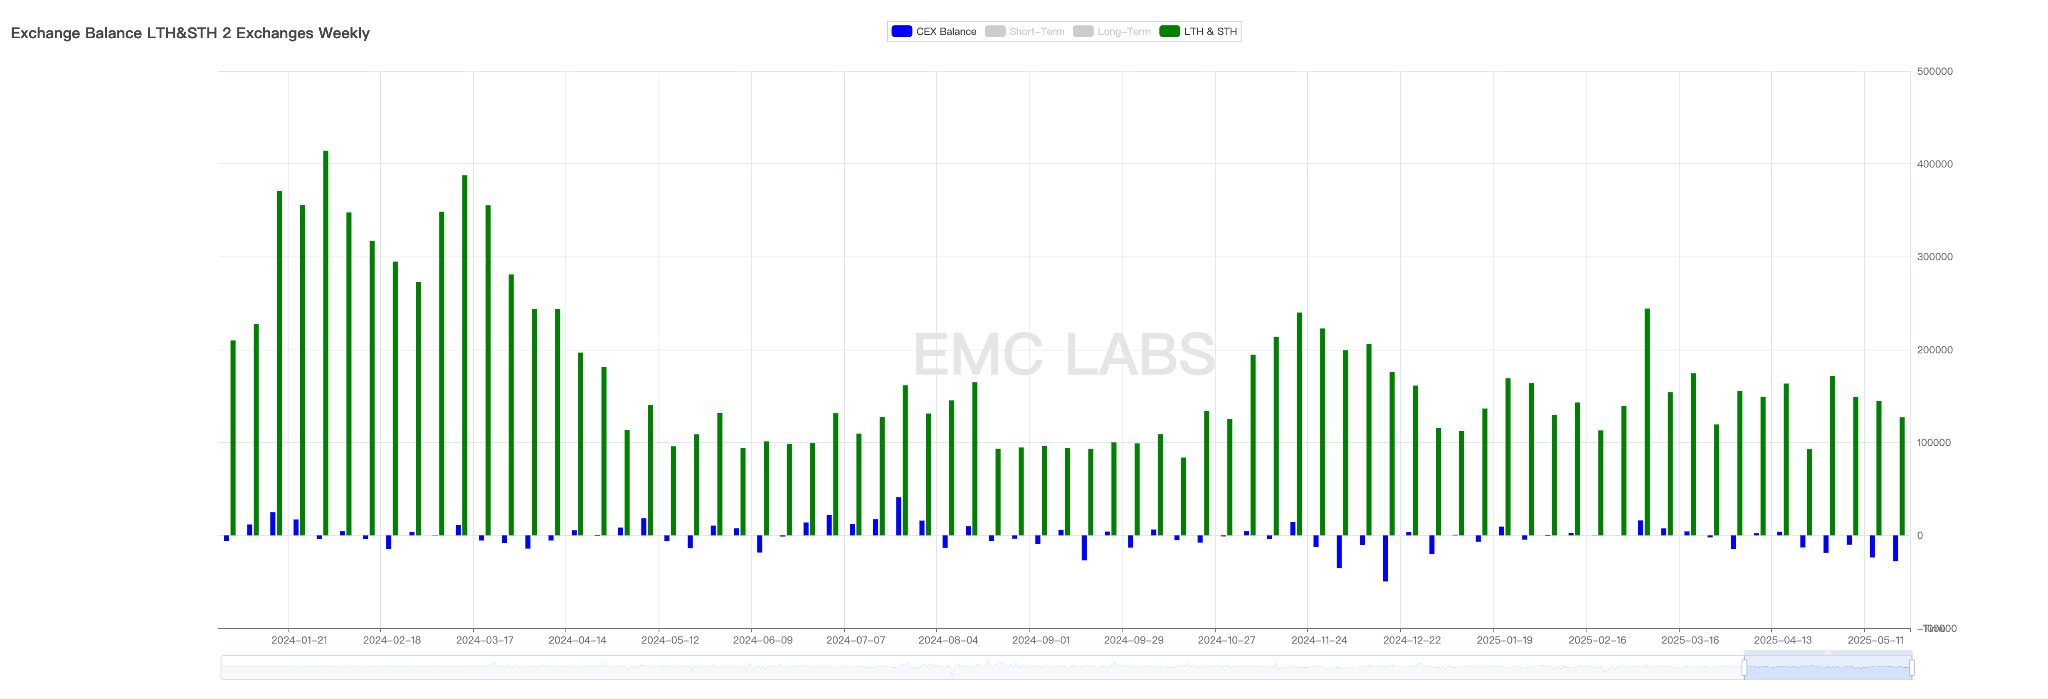
Statistics of BTC inflow and outflow in centralized digital currency exchanges
In terms of the scale of reduction, 127,226 BTC flowed into the exchange this week, which has been declining for four consecutive weeks, and the scale of outflow from the exchange reached 27,965, the highest since the beginning of this year. The reduction in the scale of selling and the increase in the scale of buying often mean a rapid rise in the future price when external conditions are met.
Cycle Indicators
According to eMerge Engine, the EMC BTC Cycle Metrics indicator is 0.875 and is in an upward period.
