
Institutional leverage and liquidation risk: BTC’s momentum before a breakthrough
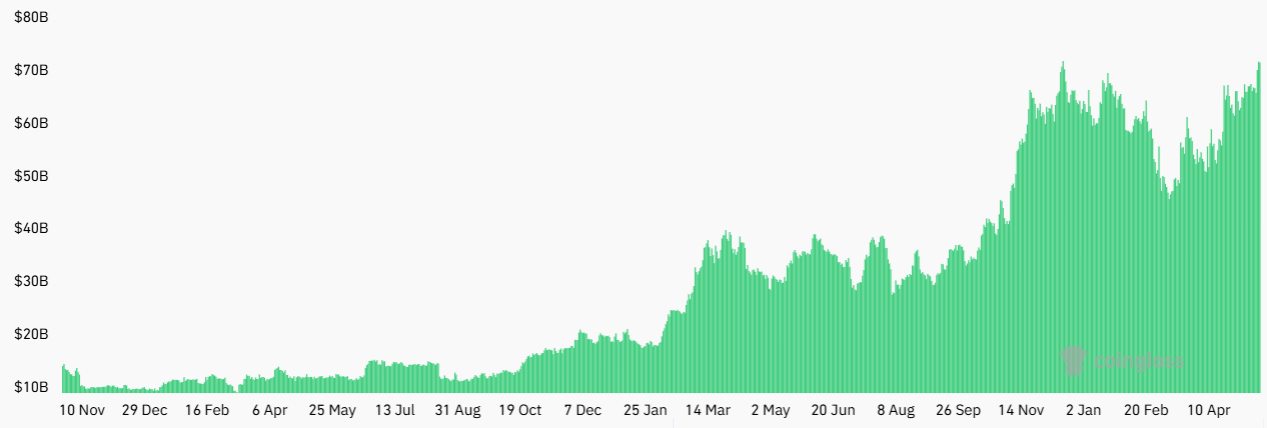
Bitcoin futures total open interest (USD). Source: CoinGlass
On May 20, 2025, the total open interest of Bitcoin futures reached a historical peak of US$72 billion, an increase of 8% from US$66.6 billion a week ago. This data not only set a new record for the cryptocurrency derivatives market, but also revealed the strong confidence of institutional investors in BTC. In terms of position distribution, the Chicago Mercantile Exchange (CME) dominated with a contract volume of US$16.9 billion, followed by Binance with US$12 billion, showing the joint efforts of traditional finance and crypto-native platforms. This phenomenon echoes the market pattern when MicroStrategy bought a large amount of Bitcoin in 2021, but the depth and breadth of current institutional participation are no longer comparable-the number of Bitcoins held by the listed company MicroStrategy alone has reached 576,000, with a market value of more than US$60 billion.
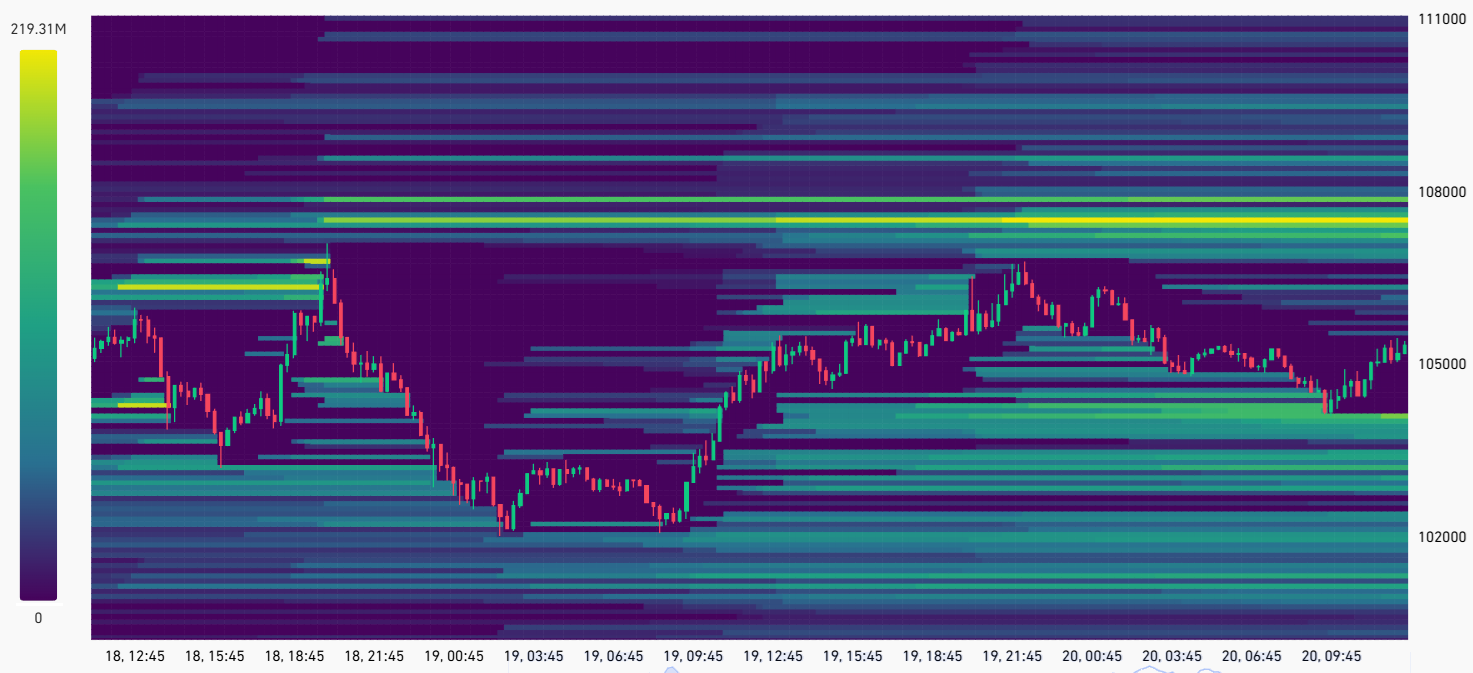
Bitcoin futures leverage heat map, unit: million US dollars. Source: CoinGlass
The market is focused on the risk of $1.2 billion in short liquidation in the $107,000 to $108,000 range. CoinGlass data shows that this price band gathers the largest leveraged short positions in the history of cryptocurrencies. Once the price breaks through this threshold, it will trigger a chain reaction of forced liquidation. It is worth noting that the structure of this liquidation heat map is highly similar to the market characteristics when Bitcoin hit $69,000 in 2021. At that time, the liquidity siphon effect caused by short liquidation pushed the price to soar 35% in two months. The current macroeconomic environment adds to the possibility of a breakthrough: the 20-year U.S. Treasury yield continues to hover at a high of 5%, reflecting market concerns about the sustainability of the U.S. government debt, and the Federal Reserve may be forced to intervene in the Treasury market to maintain stability, which will further weaken the U.S. dollar credit system and prompt funds to shift to anti-inflation assets such as Bitcoin.
The reserve game between gold and Bitcoin
In the wave of global asset reconfiguration, Bitcoin is gradually eroding gold's safe-haven status. As of May 2025, although the market value of gold is still as high as 22 trillion US dollars, its 24% increase this year has shown signs of fatigue, while Bitcoin's market value of 2.1 trillion US dollars is already comparable to silver, becoming an indispensable component of institutional asset portfolios. More symbolically, some US lawmakers have begun to discuss the proposal to convert 5% of gold reserves into Bitcoin - if this move is implemented, it will bring in $105 billion in capital inflows, enough to push the price of Bitcoin above $120,000. Behind the evolution of this reserve structure is an important signal that Bitcoin's attributes as "digital gold" have been recognized at the sovereign level.
From the perspective of market structure, the institutionalization process of Bitcoin has entered a new stage. The design of CME futures contracts, each representing 5 Bitcoins (about 514,000 US dollars), naturally filters out retail investors, making the changes in the platform's holdings more reflective of the true trends of professional institutions. The current CME open interest is 13% lower than the January price high, but the Bitcoin price has only fallen 5.8%. This divergence suggests that institutions are quietly building positions during price corrections, accumulating energy for the next round of increases. This strategy resonates with Michael Saylor's enterprise-level Bitcoin strategy of "increasing holdings regardless of cost", and together builds a value consensus to combat short-term fluctuations.
Ethereum's technological breakthrough and market test
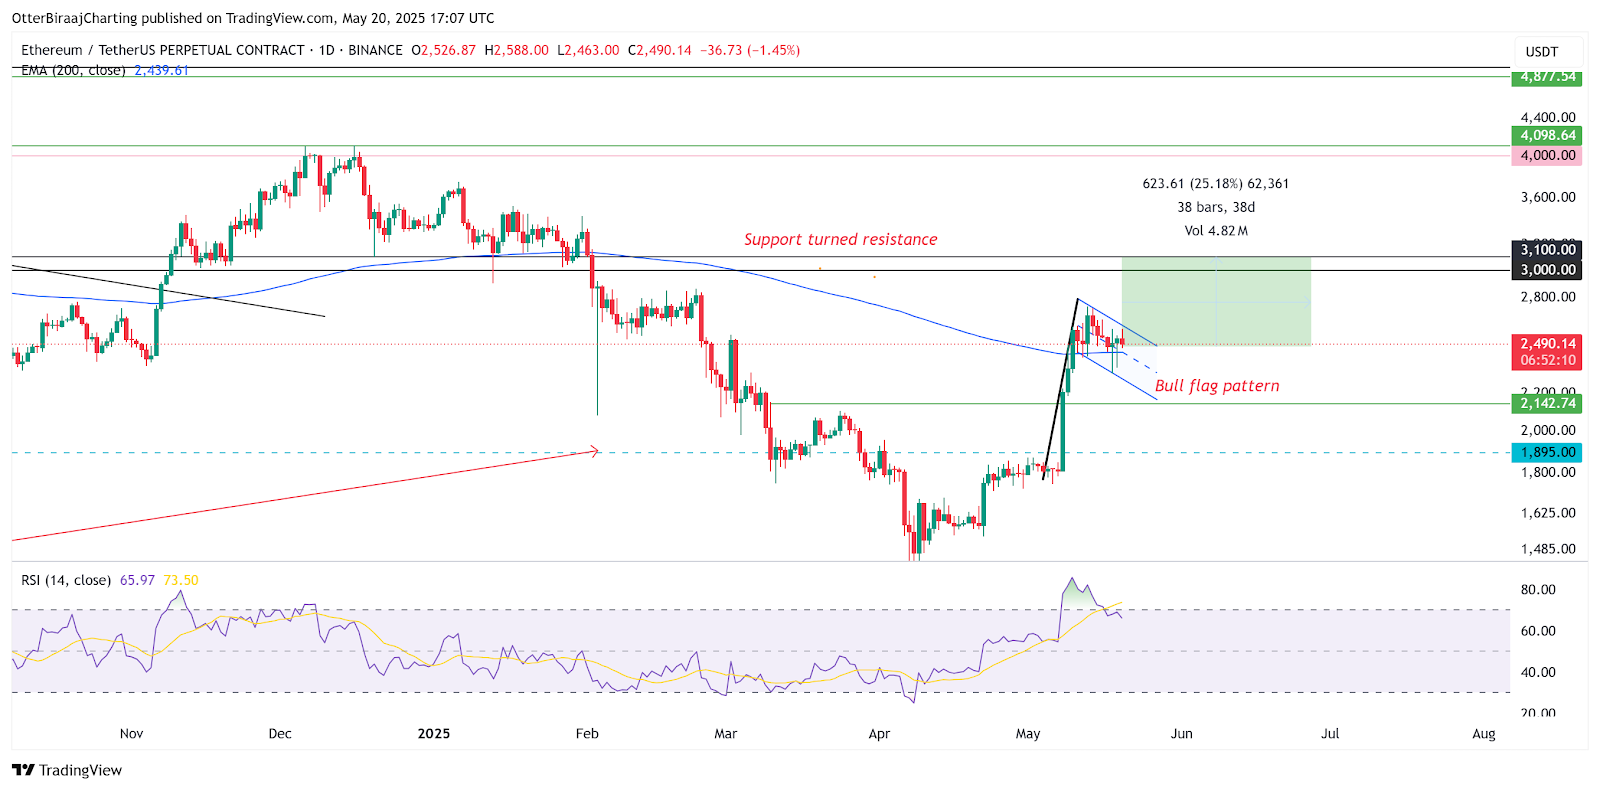
Ethereum 1-day chart. Source: TradingView
While Bitcoin is hitting its all-time high, Ethereum's technical pattern is also showing signs of a breakthrough. On the daily chart, ETH's bullish flag pattern formed in the $2,400 to $2,750 range is nearing its end, with the target of the pattern pointing to the $3,000-3,100 resistance zone.
If it succeeds in breaking through, the theoretical increase based on the height of the flagpole can reach $3,600, which will be another major market after the 93% surge in 2023. The resonance of technical indicators strengthens bullish expectations: the golden cross formed by the 50-day and 200-day moving averages appears on the 12-hour chart. Although the reliability is weaker than the daily level, it still sends a signal that the medium-term trend is strengthening.
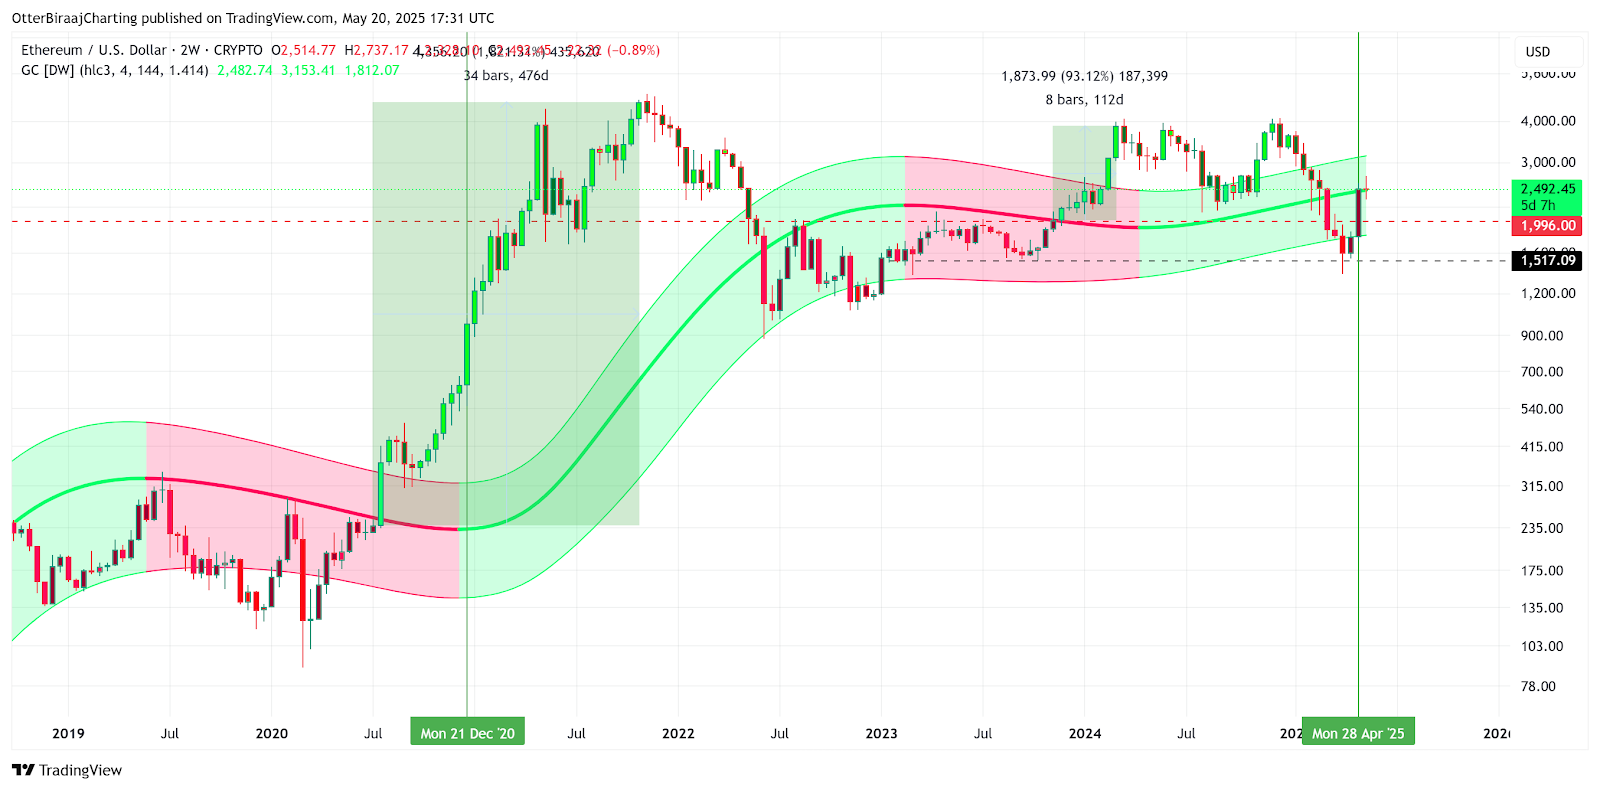
Ethereum Gaussian channel analysis. Source: Cointelegraph/TradingView
Gaussian channel analysis provides a deeper historical reference for Ethereum. After the ETH price hit the middle line of the channel on May 20, the market closely watched whether it could replicate the legendary 1,820% increase in 2020, when a similar breakthrough triggered a full-scale outbreak of altcoins.
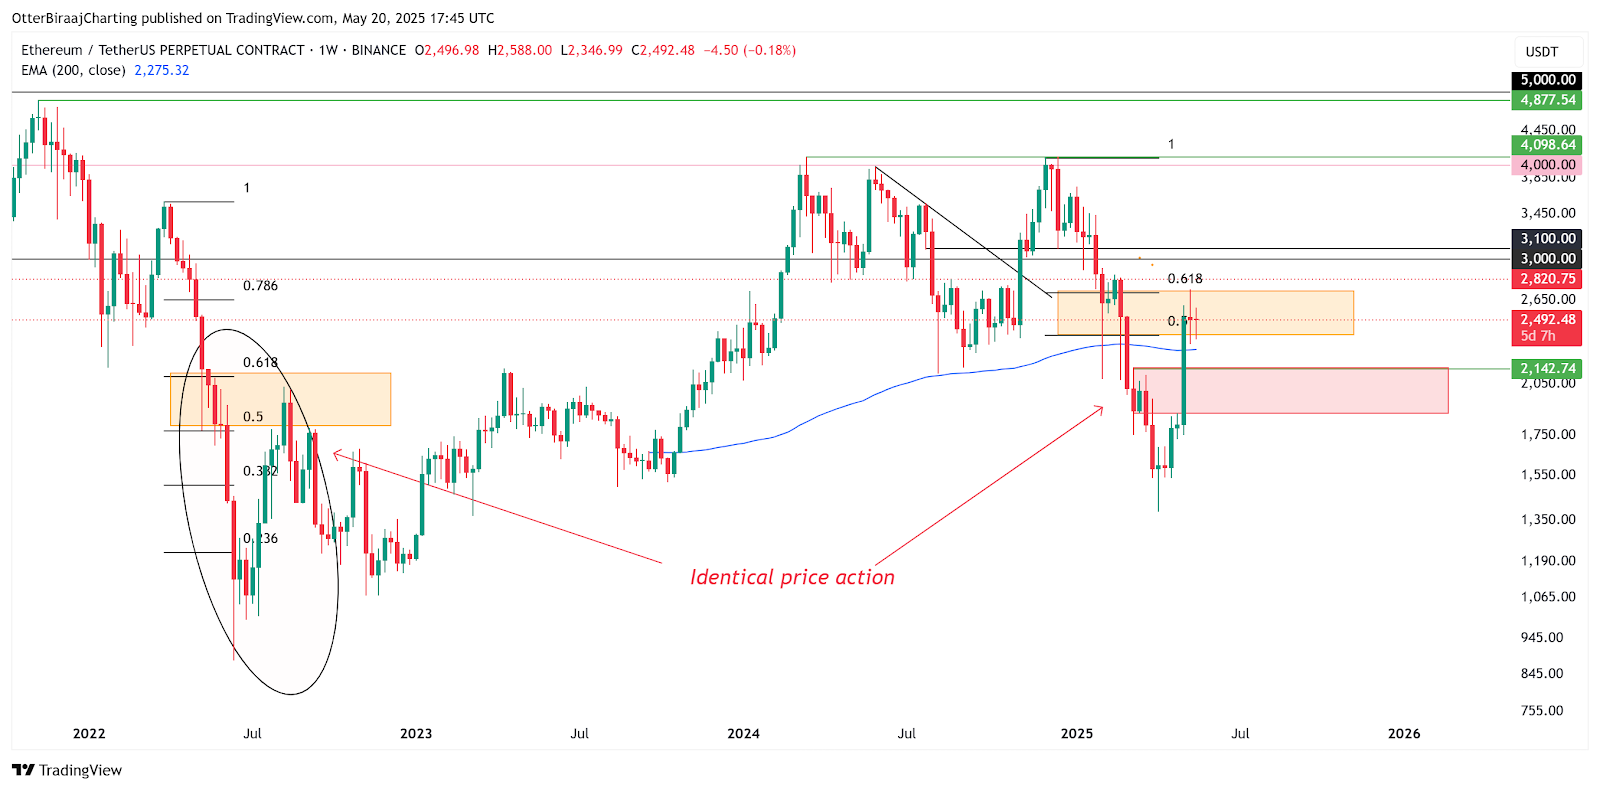
Ethereum weekly price analysis. Source: TradingView
However, the cautious attitude of trader XO is worth noting: there is significant resistance below $2,800. If it cannot be effectively broken through in the next few weeks, ETH may fall into a box shock of $2,150-2,750. This divergence is reflected in the Fibonacci retracement level. The repeated testing of the 0.5 to 0.618 range not only exposes the hesitation of the bulls, but also suggests that the market needs a stronger catalyst to break the balance.
The struggle between macro variables and market sentiment
The fundamental force driving the cryptocurrency market has always come from the cracks in the traditional financial system. The size of the U.S. government debt has exceeded $36.2 trillion, and the differences between the Democratic and Republican parties on fiscal policy are difficult to bridge. This political economic dilemma is being transmitted to the crypto market through the U.S. Treasury yield curve. When the 10-year U.S. Treasury yield climbed to a 14-month high of 4.79%, the valuation model of risky assets encountered severe challenges, but Bitcoin showed unique resistance to pressure - its 42% annual increase has outperformed the U.S. stock market, proving that the correlation between digital assets and traditional markets has structurally separated.
Changes in the regulatory environment are also worth pondering. Grayscale Research pointed out that the differences in the attitudes of candidates in the US presidential election towards cryptocurrencies may affect the medium- and long-term market trends. The Trump team's policy trial of allowing Bitcoin payments contrasts with the Biden administration's focus on compliance supervision. This political game has injected new uncertainty into the market. But the deeper trend is already clear: no matter who enters the White House, the reality that the US government debt/GDP ratio has exceeded 150% is difficult to reverse. This continued loss of fiat currency credit will eventually push more institutional investors into the arms of Bitcoin.
