
Author: Mars Finance
Introduction: The mystery of digital asset resilience in turbulent times
In June 2025, the global financial market is undergoing an epic stress test: Ukrainian drones destroyed 41 nuclear bombers, triggering a nuclear proliferation panic; the Sino-US tariff war is re-emerging; Middle East missiles streak across the night sky... Traditional safe-haven asset gold has broken through $3,450/ounce and is approaching a new high, while Bitcoin has shown amazing stability at the $105,000 mark. This "desensitization" to geopolitical crises reflects the profound changes in the underlying logic of the crypto market. This article will decode the survival rules of Bitcoin in macro shocks from three dimensions: market structure, macro cycle, and monetary order reconstruction.
1. The transmission mechanism of geopolitical shocks has failed: from panic amplifier to risk isolator
1. The “blunting effect” of conflict shock
During the Israeli airstrike on Iran's nuclear facilities on June 13, Bitcoin fell 2% in 2 hours and then quickly stabilized, in stark contrast to the 10% plunge in a single day during the Russia-Ukraine conflict in 2022. This improvement in stress resistance stems from the qualitative change in market structure: Glassnode data shows that in 2025, the proportion of long-term holders (LTH) exceeded 70%, and the proportion of speculative chips fell to a five-year low. The hedging system established by institutional investors through the derivatives market effectively buffered the instantaneous impact of emergencies.
2. Paradigm shift in risk aversion logic
The traditional perception of Bitcoin as "digital gold" is being redefined. With the Fed's interest rate cut cycle expected to start, the negative correlation between Bitcoin and the 10-year U.S. Treasury bond real yield (-0.72) has significantly increased, making it closer to a "liquidity hedging tool" rather than a pure safe-haven asset. When the U.S. Treasury auction on June 1 was cold, causing real interest rates to soar, Bitcoin's reverse pull-up verified this new attribute.
3. “Targeted absorption” of geo-premium
The energy supply chain crisis caused by the Middle East conflict has objectively accelerated the process of de-dollarization. The proportion of oil exports settled by the Central Bank of Iran through Bitcoin has exceeded 15%. This penetration of the real economy has partially transformed geopolitical risks into rigid demand for Bitcoin. Blockchain analysis company Chainalysis monitoring shows that the on-chain transaction volume of wallet addresses in conflict areas has surged by 300% after the incident.
2. Nested game of macro cycles: the dual support of interest rate cut expectations and inflation easing
1. The certainty of the dividends from the monetary policy shift
The CME Fed Observation Tool shows that the market's expected probability of a rate cut in Q3 has reached 68%, which is directly reflected in the steepening of the Bitcoin term structure: the annualized premium of futures contracts rose to 23% on June 15, a record high since the halving in 2024. Historical data shows that in the three months before the start of the rate cut cycle, Bitcoin's average increase was 37%, far exceeding the 12% of gold.
2. Structural solution to inflation stickiness
In May, the core PCE price index fell to 2.8% year-on-year, and the supply chain pressure index (GSCPI) fell back to pre-epidemic levels. This weakened Bitcoin's anti-inflation narrative, but unexpectedly released its "growth-sensitive asset" attribute. MicroStrategy's latest financial report shows that the accounting treatment of corporate holdings of Bitcoin has changed from "intangible assets" to "strategic reserves", indicating that institutions have begun to include it in the valuation framework of growth stocks.
3. Arbitrage space in the divergence of US and Chinese policies
The People's Bank of China has increased its gold reserves to 30,000 ounces for six consecutive months, while the U.S. Treasury Department has pushed the U.S. dollar index down 12% this year through a "controlled depreciation" strategy. This divergence of monetary policies has given rise to a gray channel for cross-border capital to arbitrage through Bitcoin. Chainalysis has monitored that the volume of Bitcoin OTC transactions in the China-U.S. trade corridor increased by 470% during the tariff dispute.
3. Deep changes in market structure: from retail investor carnival to institutional pricing
1. Deleveraging of holding structure
In 2025, the proportion of hedging positions in futures open contracts exceeded 60% for the first time, and the funding rate of perpetual contracts remained stable at below 0.01%/day. This change has made the market no longer dependent on leveraged funds, and the common "double explosion of long and short" phenomenon in 2021 has basically disappeared. The scale of management of BlackRock Bitcoin ETF exceeded US$130 billion, and its daily net subscription volume showed a significant negative correlation with the S&P 500 Volatility Index (VIX).
2. "Layered reinforcement" of liquidity structure
The balance of Coinbase's institutional custody account exceeded 4 million bitcoins, accounting for about 21% of the circulation. This type of "cold storage" chips forms a natural price stabilizer, making it difficult for short-term selling pressure to break through key support levels. When the Iranian missile attack on June 14 triggered panic selling, more than $3 billion of buying orders emerged at the $100,000 mark, 90% of which came from institutional OTC counters.
3. “Traditional Fusion” of Valuation System
The 90-day correlation between Bitcoin and the Nasdaq 100 Index fell from 0.85 in 2021 to 0.32, but the correlation with the Russell 2000 small-cap stocks rose to 0.61. This shift reflects that the market is reconstructing the valuation logic using traditional asset pricing models: Bitcoin's volatility (annualized 45%) is close to the level of technology growth stocks, far lower than 128% in 2021.
4. Short-term price analysis
Bitcoin found support at the 50-day simple moving average ($103,604) on Friday, but the bulls struggled to push the price above the 20-day exponential moving average ($106,028). This shows a lack of buying at highs.

BTC/USDT daily chart. Source: TradingView
According to the BTC/USDT daily chart, the 20-day EMA is flattening out and the relative strength index (RSI) is near the midpoint, which does not give a clear advantage to the bulls or bears. If buyers push the price above the 20-day EMA, the BTC/USDT pair could climb to the $110,530-$111,980 range. Sellers are expected to strongly defend this upper zone, but if bulls gain the upper hand, the pair could surge to $130,000.
On the downside, a break below the 50-day simple moving average (SMA) could challenge the key psychological level of $100,000. If this level is breached, the pair could fall to $93,000.
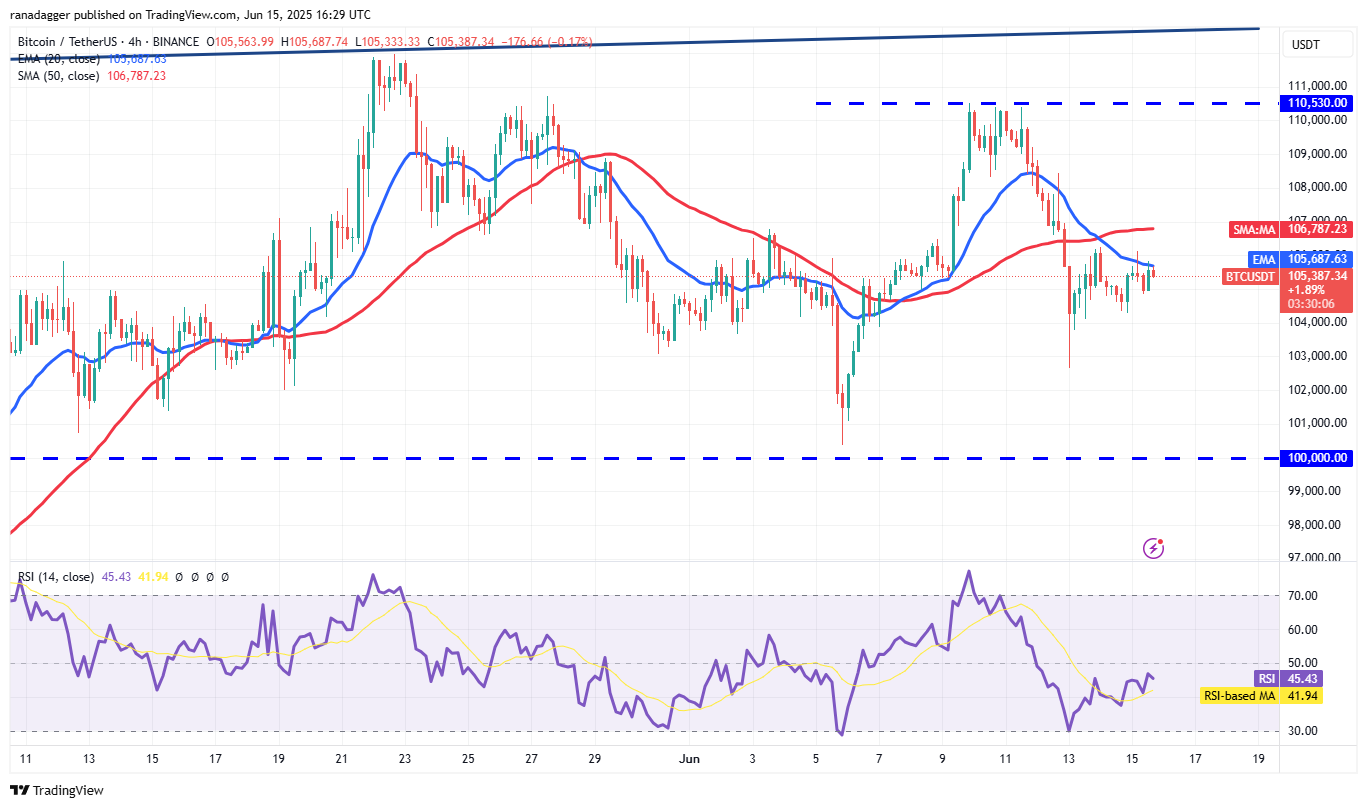
BTC/USDT 4-hour chart. Source: TradingView
Sellers are attempting to stall the price rebound at the 20-day EMA on the 4-hour chart. If the price declines sharply and breaks below $104,000, the short-term advantage will shift in favor of the bears. The pair could drop to $102,664 and then to $100,000. Buyers are expected to strongly defend the $100,000 level.
The bulls must push the price above the 50-day simple moving average (SMA) to take control. After that, the pair can surge to $110,530.
5. Future Path Deduction: Summer Dormancy and Autumn Offensive
1. June-August: The period of oscillation accumulation
The Fed's policy vacuum may cause Bitcoin to fluctuate in the range of $98,000-112,000. The key observation point is whether the July FOMC meeting will release a clear signal of interest rate cuts. Technically, the 200-day moving average (currently at $96,500) will provide strong support. The pulsed impact of geopolitical conflicts still exists, but the market depth indicator shows that the amount of funds required for every 1% price fluctuation has increased to three times that of 2022.
2. September-November: The main uptrend starts
Historical seasonal patterns show that the average increase in October reached 21.89%. With the Fed's possible first rate cut, Bitcoin may start its journey to $150,000. By then, the peak of US debt maturities (US$6.5 trillion) may force the Fed to expand its balance sheet, and the secondary release of US dollar liquidity will become the best catalyst. The options market has seen a large accumulation of call options with December expiration and an exercise price of $140,000.
3. Risk Warning: Regulatory Gray Rhinos
The SEC's enforcement action against stablecoin issuer Paxos may cause short-term volatility, but in the long run, the regular approval of spot ETFs will attract more than $200 billion of traditional asset management funds. Investors need to be wary of the "Christmas pullback" after the November surge. Historical data shows that the average retracement during this stage of the bull market cycle is 18%.
Conclusion: Bitcoin’s Position in the New Monetary Order
As gold is about to break through $3,500, the U.S. Treasury yield curve continues to invert, and the proportion of RMB cross-border settlement exceeds that of the U.S. dollar, we are witnessing the most profound monetary revolution since the collapse of the Bretton Woods system. Bitcoin plays a dual role in this change: it is both a beneficiary of the collapse of the old system's credit and a builder of the infrastructure of the new order. Its price stability no longer comes from the reduction of volatility, but from the reconstruction of the underlying value support - from a speculative symbol to a liquidity bridge connecting the real economy. Perhaps as Dalio of Bridgewater Fund said: "In the long winter of the reconstruction of the fiat currency order, Bitcoin is proving to be the most frost-resistant seedling."
