
Author: 0xWeilan
After some funds exited the market following the September interest rate cut as a "sell the fact," both on-exchange and off-exchange capital regrouped, driving a new round of price increases for BTC, which reached a record high of $126,296.00 on October 6 (Coinbase quote, same below). However, this surge was interrupted on October 10 by the renewed escalation of the US-China trade war. BTC subsequently plummeted, falling to a low of $103,516.75 within several trading days, a drop of over 18%.
Subsequently, following the consensus reached between the US and China during the APEC meeting to suspend several confrontational measures, the Federal Reserve also lowered interest rates for the second time this year on October 29th. Coupled with better-than-expected Q3 earnings reports, US stocks hit a new monthly high. However, BTC's rebound was weak, still struggling around the 200-day moving average (the upper edge of the "Trump bottom" at $110,000), a key bull-bear dividing line, and by the end of the month, it had given back all the gains since July.
The performance of BTC and the crypto market this month has been influenced by a complex interplay of factors, including improved macro liquidity, the US-China "reciprocal tariff" war, cyclical sell-offs, and the outflow of major funds in the new cycle.
Currently, with renewed uncertainty surrounding interest rate cuts and risk appetite not yet fully recovered, cyclical selling (the cyclical pattern) has become the main force driving BTC's price movement. Without further economic and employment data to support this, and with risk appetite shifting and capital inflows continuing, a sustained sell-off could trigger a "long squeeze" if BTC effectively breaks below the bull-bear dividing line, significantly increasing the probability of the BTC cycle ending.
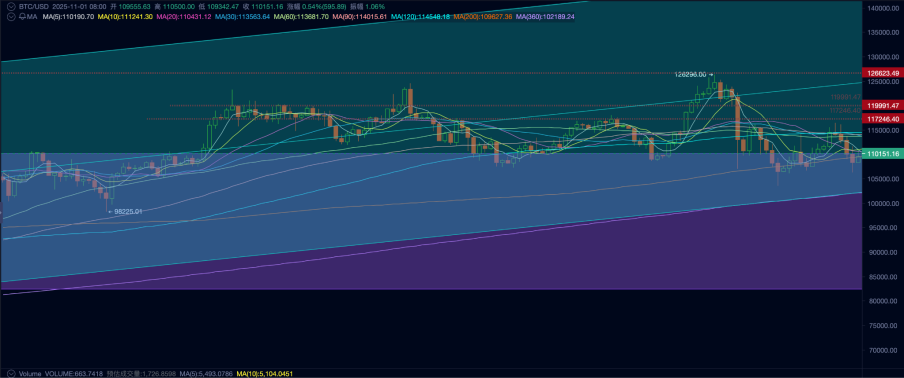
BTC price daily chart
The US-China "reciprocal tariff" war: temporarily over, but the standoff will continue for a long time.
After the interest rate cut "sold the fact," BTC followed suit and entered a new trend in early October.
On October 10, the US announced an additional 100% increase in tariffs on some Chinese imports and threatened to impose export controls on "critical software"; global risk assets weakened and the crypto market plunged.
From the 24th to the 25th, delegations from both sides held talks in Malaysia. On the 30th, the leaders of the US and China held face-to-face talks in South Korea, the host city of APEC. Achievements included the US reducing its average tariffs on Chinese goods from approximately 57% to about 47%, China suspending a new round of rare earth restrictions for one year, resuming agricultural product purchases, and advancing cooperation on fentanyl enforcement; however, deep-seated issues such as structural competition and confrontation between the two sides remain far from resolved. US stocks rebounded, but the BTC and cryptocurrency markets, due to severe internal structural damage caused by the rapid decline, are still consolidating at low levels.
Escalating tariffs increase inflation and growth uncertainty, leading the market to favor a combination of a stronger dollar and resilient real interest rates in the short term, thus compressing risk appetite for high-beta assets such as crypto. This is the transmission path of the US-China "reciprocal tariff" war's impact on the crypto market.
As can be seen, since its low of 96.214 on September 18, the US dollar index has rebounded continuously, reaching 99.720 by the end of the month, and has not fallen back despite the temporary easing of the "reciprocal tariff war." The suppression of risk assets caused by the US dollar index has driven capital outflows from high-beta assets, and gold has continued to climb.
Thanks to AI narratives and strong profit growth, the upward momentum of US stocks, especially tech stocks, has not been damaged. However, the BTC and crypto markets, lacking fundamental support and relying solely on emotional impulses and capital inflows driven by consensus diffusion, have experienced a continuous outflow of funds, resulting in a 3.83% monthly decline for BTC, significantly lagging behind the Nasdaq's 4.7% monthly gain.
Although the leaders of both sides have reached a public consensus that a truce in the short term (within one year) is highly likely, we should still be wary of tail events such as "secondary tariffs/secondary embargoes".
Fed rate cut: Probability of continued rate cuts significantly reduced
On August 23, Federal Reserve Chairman Jerome Powell made a clear dovish shift at the Jackson Hole global central bank conference. The Fed then successfully completed two 50-basis-point rate cuts in September and October, temporarily easing anxiety in the US job market and funding pressures in the financial markets.
However, a clear discord emerged at the October 29th policy meeting—two voting members opposed the rate cut decision. In his subsequent remarks, Powell emphasized that a December rate cut was not "far from a foregone conclusion"; the Fed would adopt a "balanced approach" between rising downside risks to employment and sticky inflation. Then, on October 30th, several Fed officials issued hawkish statements. FedWatch showed that the probability of a December rate cut dropped by more than 30% within two days.
Because the correction was relatively thorough, the price of BTC did not continue to fall in the last two days of the month. However, the BTC Spot ETF recorded outflows of funds in both days, indicating that the market is still pricing in the probability of an interest rate cut.
Without support from economic and employment data, the probability of a December rate cut will continue to decline, and market risk appetite will continue to deteriorate in the medium term. Without other positive factors, BTC may find it difficult to find real support near the 200-day moving average. If it falls back into the "Trump bottom" range (90,000-110,000), the market under the pressure of the "cyclical law" may experience a "long squeeze" tragedy.
With the US government still in a shutdown, official economic and employment data are difficult to release in a timely manner. Short-term traders are in a data vacuum and may be more inclined to sell crypto assets that lack intrinsic growth support.
Internal structure: Long-handed investors continue to identify and sell off.
In EMC Labs' "BTC Cycle Multi-Factor Analysis Model," long-term trading behavior plays a decisive role in the formation of cycles. This group sells its holdings during cyclical uptrends and accumulates them during cyclical downtrends, acting as both a "stabilizer" and a "top shaper" in the market.
According to eMerge Engine data, the volume of long-term sell-offs reached 84,806 in October, the highest monthly figure for the year, while the total sell-off of both long and short-term contracts reached 735,930, also the highest for the year.
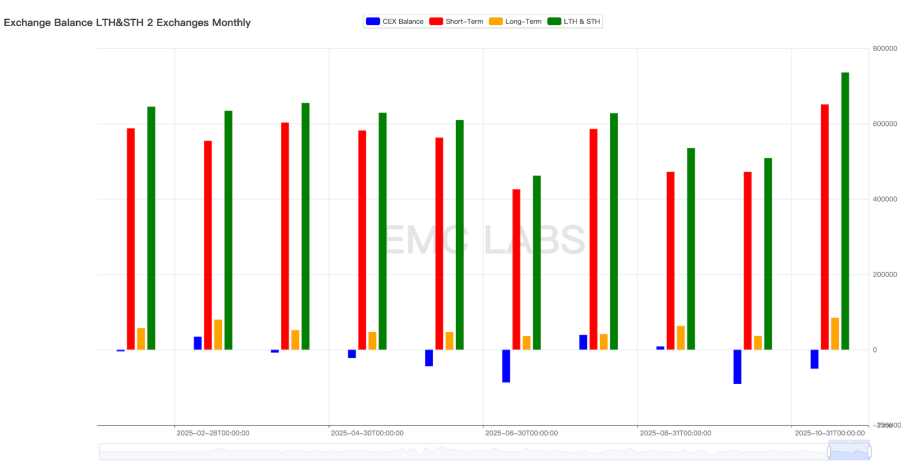
Monthly statistics on long-term and short-term trading volume and exchange stock liquidity.
This includes both selling during BTC's rise to new all-time highs and indiscriminate selling during declines. This behavior of continuous and large-scale selling regardless of whether prices are rising or falling is consistent with the long-term trading pattern observed when prices peak in past cycles.
According to the cyclical pattern, the price of BTC typically peaks approximately 1050 to 1070 days after a cyclical low. From November 21, 2022 to October 6, 2022 (the day BTC reached its all-time high), exactly 1050 days had passed. This is likely the fundamental reason why long-term holders have been continuously and aggressively selling off.
If prices rebound in the future, long positions will likely continue to sell; if prices fail to rebound or even fall, and long positions continue to sell, then BTC will likely complete the formation of the top for this cycle.
Fund flows: Buying power continues to decline
The continuation of any upward trend requires sustained capital inflows. Moreover, most of the time, price increases are the second derivative of capital inflows; that is, not only do funds need to flow in, but they need to flow in rapidly in order to drive prices up.
Over the past four months, the trend has been steadily deteriorating. From March to June, as the US-China trade war eased, accelerated capital inflows propelled BTC to new monthly all-time highs. However, from July to October, capital inflows across all channels have slowed continuously, shrinking to $9 billion in October. This continued slowdown in capital inflows failed to offset the selling pressure from long positions, resulting in a failed price attempt and ultimately a return to the upper edge of the "Trump bottom."
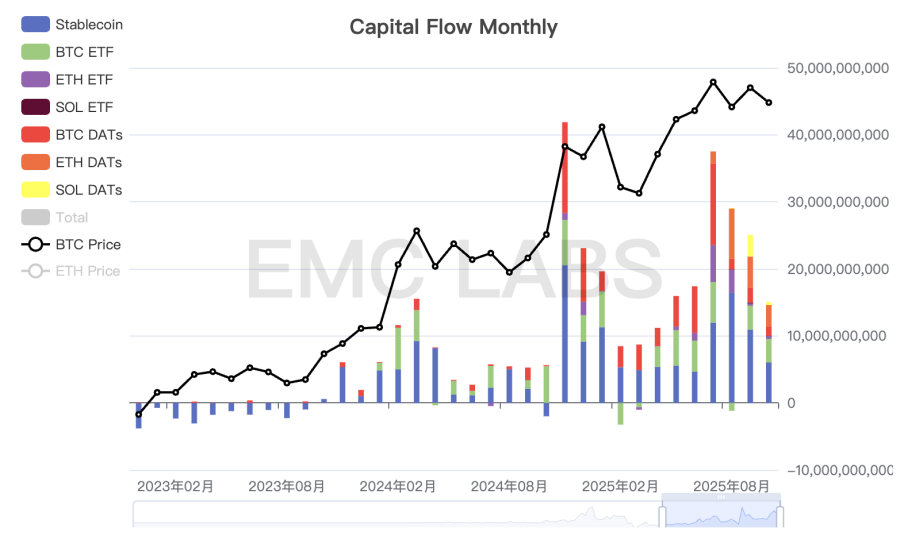
Monthly capital inflows into the crypto market
In our September report, we concluded that the surge in BTC prices driven by "macro liquidity" and "consensus diffusion" was the primary driver of this bull market. This is clearly reflected in the on-chain price action charts.
The first large-scale inflow of funds stemmed from the approval of the BTC ETF, while the second large-scale inflow came from the election of "crypto-friendly president" Trump. The third largest value realization in this bull market occurred between March and July 2025, driven by the easing of the US-China trade war and expectations of a Federal Reserve interest rate cut. However, this inflow abruptly stopped after pushing the price of BTC to $120,000.
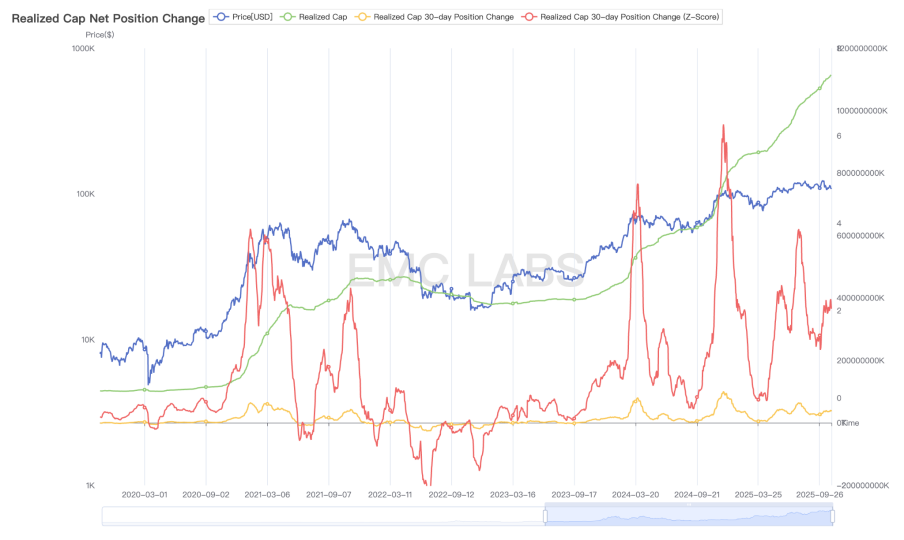
BTC On-Chain Value Realization Statistics
After the interest rate cuts were restarted, funds attempted to flow in again at the end of September, pushing the price up to $126,296. However, in October, the enthusiasm for fund inflows was curbed due to the US-China conflict. Coupled with the Binance exchange market makers' cascading liquidations caused by the USDe issue, the entire market cleared more than $20 billion in nominal leverage, which severely damaged the internal structure of the crypto market.
Following this week's market structure changes, the bullish forces in this round of bull market are concentrated in three channels: DATs, BTC Spot ETF, and Shark Accounts. Currently, DATs are experiencing a lack of buying power, BTC Spot ETFs are seeing outflows, and only Shark Accounts are continuously buying.
Looking ahead, if improved macro liquidity or increased policy support spurs a return to bullish sentiment and buying power regroups, BTC still has a chance to resume its upward trend and reach new highs. However, if sentiment remains low and funds accelerate their outflow, BTC will likely end this bull market in the fourth quarter.
Conclusion
Because endogenous growth has not yet been established, the current crypto market is still in a game of capital inflows driven by "macro liquidity + consensus diffusion" and the periodic "accumulation-selling" behavior of long-term investors.
Currently, the "macro liquidity + consensus diffusion" is still underway, but its momentum has clearly weakened, while long-term holders who believe in the "cyclical law" are adhering to their principles and continuing to sell. This game is pushing the BTC price downwards for rebalancing. In the old cycle pattern, this is a typical manifestation of the transition from the transition period to the downward period (bear market).
The form of the "new cycle" is not yet clear, so we can only believe that the "end" of the bull market is underway.
