
Author: 0xWeilan
In our June report, we noted that due to a thorough market clean-up and the significant influx of institutional investors, the next rally could be completed quickly. We originally expected this breakout to occur in August or September, but if expectations of interest rate cuts drive forward capital buying or structural allocations accelerate, we could still see the possibility of a pullback as early as July.
The market rallied as expected, and we saw this expectation quickly fulfilled in July. BTC rose 8.01% for the month and tested a new all-time high of $120,000.
This was fueled by enthusiastic corporate buying and continued inflows into ETFs and stablecoins. However, significant shifts in expectations for rate cuts and the actual implementation of the tariff war have dampened the rapid upward surge in prices and temporarily interrupted the development of the Alt Season. There remains considerable uncertainty regarding whether a rate cut will occur in September.
Since 2023, individual investors and businesses in the United States have gradually increased their allocation to crypto assets represented by BTC. After Trump was elected the 47th President of the United States in November 2024, BTC was established as a national strategic reserve, and a package of crypto-friendly policies were gradually implemented, marking the complete farewell of the barbaric era for crypto assets and the blockchain industry.
However, deep participants in the crypto market faced a dichotomy. On the one hand, BTC saw long-term increases in new investors, pushing its price to new heights. On the other hand, the Altseason seemed to be over. Ethereum, considered a cornerstone of the blockchain industry, plummeted to $1,300 in April, falling below its initial price in this bull market, leaving market participants exclaiming, "Faith is shattered." However, ETH rebounded 48.80% in July.
EMC Labs believes the crypto industry is at a historic turning point, facing unprecedented structural changes and hidden trends, presenting enormous challenges. The factors determining asset prices have undergone a dramatic shift, from a previously declining supply-demand cycle and speculative frenzy to an emerging asset allocation logic across all asset classes.
We are in the midst of a massive industrial change.
Macro Finance: Inflation Rebound vs. Non-farm Payroll Surprise
In July, the U.S. capital market was primarily driven by the game of three major variables: "when will the Federal Reserve resume rate cuts, how will the tariff war end, and the performance of economic and inflation data." Slightly fanatical forward-looking trading dominated the market, with active long positions most of the time, and a trend of correction after the end-of-month news exceeded expectations.
The Federal Reserve's resumption of interest rate cuts was a dramatic month. On the one hand, Trump continued to exert extreme pressure on social media, even visiting the Fed to intimidate Chairman Powell by claiming excessive maintenance projects. On the other hand, the Fed, adhering to its dual mandate of "inflation and employment," remained data-driven and took a hawkish stance after the FOMC meeting. A split emerged within the Fed, with Governors Waller and Bowman explicitly supporting a swift rate cut, and Governor Kugler unexpectedly resigning.
After the FOMC meeting on July 31, FedWatch's probability of a September rate cut fell to a low of 41%. However, after the release of the unexpectedly strong non-farm payroll data for July on August 1, this probability pricing quickly climbed to over 80%.
For most of its history, the S&P 500's performance was driven by expectations of a September interest rate cut and strong corporate earnings. However, after July 28th, as the probability of a September rate cut decreased, the market began to adjust after three consecutive months of significant gains. BTC subsequently fell below $115,000, while altcoins, such as ETH, experienced even greater declines.
In his speech after the FOMC meeting, the Federal Reserve Chairman emphasized that the impact of tariffs on inflation data may further increase in the next two months.
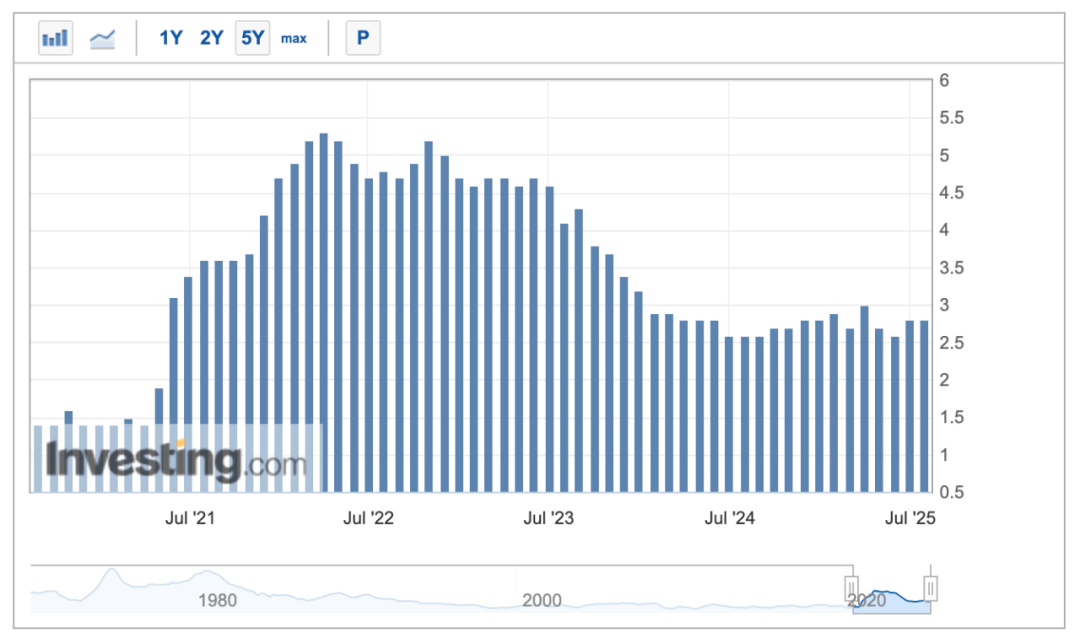
US PCE data
In July, Trump announced tariffs on more countries, exceeding market expectations. After a two-month lull, the tariff war, which is in the process of winding down, has once again become a major factor influencing market pricing.
The current "reciprocal tariff" system consists of a four-tiered structure: a 10% base rate, a 15–41% country-specific gradient, a special EU formula, and a 40% transshipment penalty. The top tier, 41%, targets regions with high geopolitical security risks; the mid-tier, 25–35%, targets partners with large trade surpluses, high barriers, and limited negotiation progress; and the 10% base rate is widely used as a temporary reprieve for China.
Among major trading partners/regions, the EU holds 15%, Canada 35%, Japan 15%, South Korea 15%, Mexico 10% (general goods)/25% (automobiles, etc.)/50% (steel, aluminum, and copper) (still under negotiation), and China 30% (suspended for 90 days pending). This result exceeded market expectations and heightened concerns about rising inflation, leading the market to price downwards and rebalance around August 1st.
In terms of economic and employment data, the US economy as a whole demonstrates relative resilience and relatively strong growth. The US Q2 GDP, released on July 30th, reached an annualized rate of 3%, reversing the negative growth trend in Q1 and exceeding expectations. The financial reports released by major technology companies in July also show that the AI wave is driving large enterprises to increase their investments, and AI investments are already driving profit growth.
Of course, there are hidden concerns behind the data. Consumption recovery remains weak and overall corporate investment remains sluggish.
The July non-farm payroll data, released on August 1st, dealt a heavy blow to the market, leading to a sharp drop in US stocks. The data showed that non-farm payrolls increased by only 73,000 in July, significantly below the expected 110,000. Furthermore, May's non-farm payroll data was revised down by 125,000 from 144,000 to 19,000, and June's was revised down by 133,000 from 147,000 to 14,000, for a total downward revision of 258,000 for both months. These figures significantly exceeded market expectations, reigniting market fears of a "soft landing" and prompting downward pricing to rebalance.
Throughout the month, the market rallied on expectations of interest rate cuts and a non-landing economy. However, the tariff rates and non-farm payrolls released at the end of the month "severely" hit the market downward pricing.
For the month, the Nasdaq, S&P 500, and Dow Jones indices rose 3.7%, 2.17%, and 0.08%, respectively. BTC rose 8.01%, and ETH rose 48.8%.
The US stock market is still at risk of downward rebalancing in August. After the unexpected non-farm payroll data, the probability of a rate cut in September has returned to 80%. However, concerns about a rebound in inflation still plague the rate cut expectations. In addition, although the employment data has not dealt a fundamental blow to the US economic growth for the whole year, it still poses a problem.
Whether the interest rate can be cut as scheduled in September, the inflation and non-farm payroll data to be released in the coming month will attract much attention.
Crypto assets: BTC rises and the Altseason may begin
In July, BTC opened at $107,173.21 and closed at $115,761.13, with a low of $105,119.70. It hit a record high of $123,231.07 during the month, with a monthly increase of 8.01% and an amplitude of 16.9%. The trading volume was significantly larger than that in June.
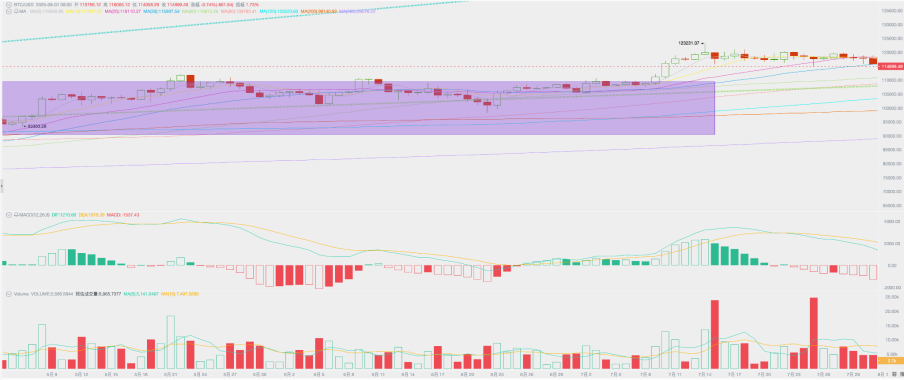
BTC price daily chart
In our June report, we noted that BTC had been oscillating within the "Trump bottom" (purple area in the chart above) for eight months, with ample turnover, indicating that conditions were in place to initiate a fourth wave of the rally in Q3. As expected, the market broke through this area in July and continued its upward surge for several trading days. However, starting in mid-July, selling by long-term investors, particularly whales, coupled with a volatile macro-financial environment, prevented BTC from continuing its upward climb and instead entered another period of consolidation.
Judging from technical indicators, BTC is still running above the 60-day moving average and the first rising trend line of the bull market (green dotted line in the above figure), with monthly trading volume increasing, and is in the middle of a new round of upward relay.
From a monthly perspective, the MACD fast and slow lines are still in the expansion stage, indicating that the market is still in strong upward momentum.
In terms of contracts, the size of positions continued to rise from the beginning of the month to the end of the month, indicating that the market was bullish, but starting from the end of the month, both the size of positions and funding rates showed a significant decline. Against the backdrop of increasing uncertainty, a certain amount of leveraged funds chose to exit the market for risk aversion.
Another significant development in July was the seemingly renewed Alt Season within the crypto market. Driven by strong corporate buying, ETH saw a 48.8% monthly increase, with the ETH/BTC pair breaking through technical indicators. We believe the renewed Alt Season is highly likely as risk appetite rises with the approach of rate cuts.
Chip structure: Cycle long hands initiate the third round of selling
With the arrival of buying power in July, the long-term holding group started the third wave of selling in this bull market.
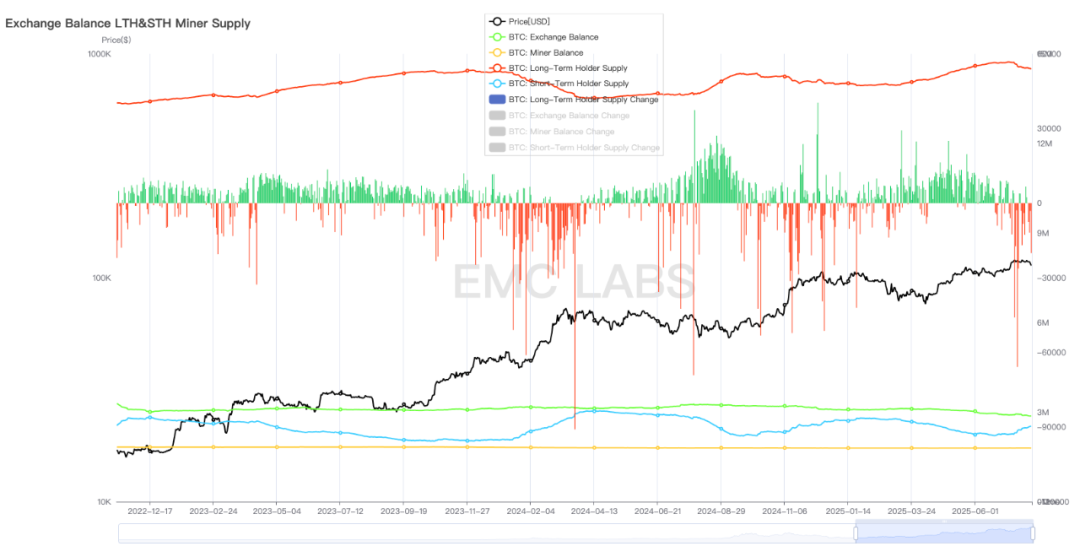
Long and short positions and changes
According to eMerge Engine data, long-term investors reduced their holdings by nearly 200,000 BTC in July, including 80,000 held in a wallet dating back to the Satoshi era. Meanwhile, short-term holdings also saw a rapid increase.
BTC flows from long to short hands, increasing the short-term liquidity of the market and suppressing prices. However, it can be seen that the short-term selling of ancient whales has a much smaller impact on market prices than in the past, indicating that with the change in market participation structure, the market depth has increased significantly.
BTC continues to flow out of centralized exchanges (over 40,000), indicating continued institutional purchases. Institutional allocations are the direct driving force behind BTC's price increase during this bull market.
As of the end of July, listed companies’ direct holdings of BTC exceeded 4.5% of the total supply.
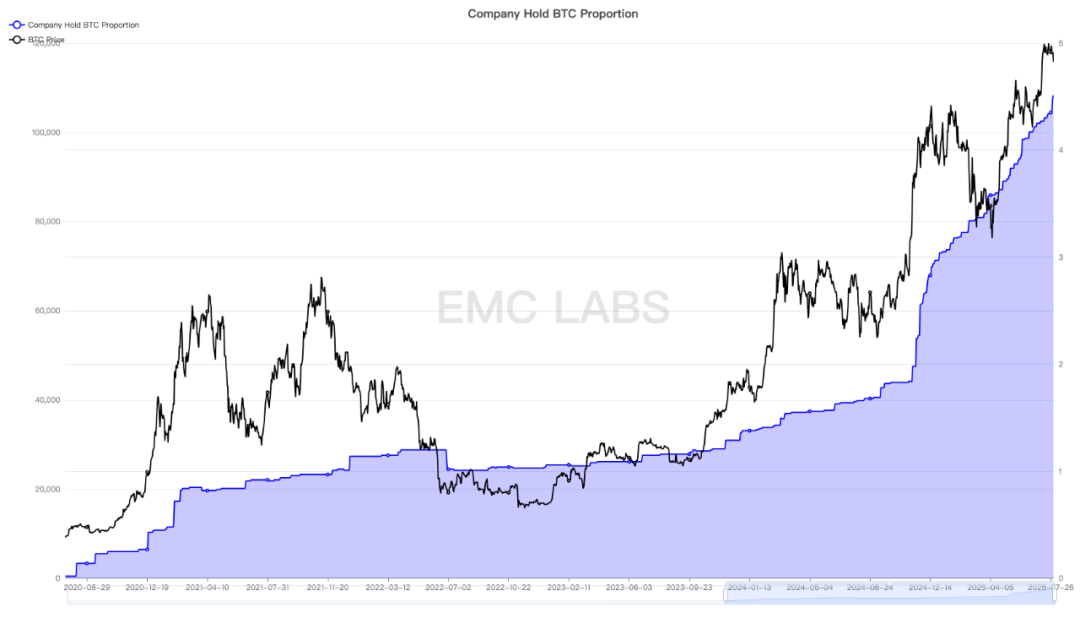
Statistics on the scale of BTC held by the company
Since the beginning of this year, the scale of direct purchases of BTC by listed companies and other institutions for inclusion in their treasury has exceeded that of the BTC Spot ETF channel, officially becoming the largest buyer in the BTC market.
Capital flows: Over $29.5 billion flowed in, making it the second largest month in history
Over $29.5 billion flowed into the crypto market this month, including $12 billion in stablecoins, $11.3 billion in the BTC+ETH Spot ETF, and $6.2 billion in corporate purchases. Corporate purchases are the single largest source of BTC market buying power.
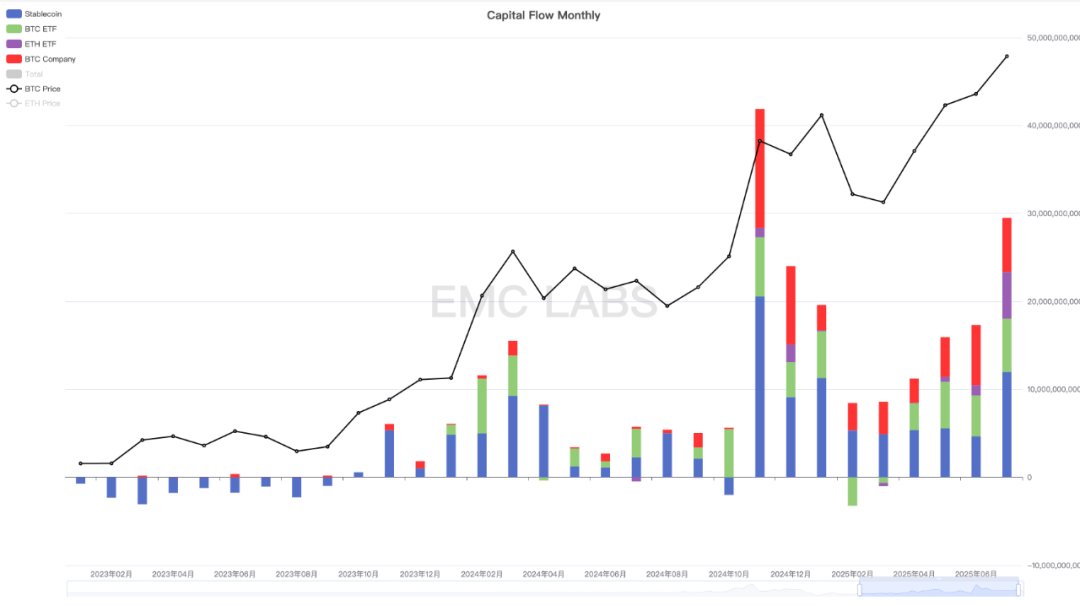
Monthly statistics on capital flows in the crypto market
The total inflow of $29.5 billion made July the second largest inflow month in history, which provided material support for BTC to break through the 8-month consolidation area and absorb huge selling pressure to push the price to a new historical high.
It is worth noting that total capital inflows have grown for five consecutive months, pushing BTC to continue climbing from its six-month low in April and setting a new all-time high.
The allocation of BTC by American companies continues to accelerate, with more and more companies joining in. It is expected that this will remain the most important factor driving price increases for some time to come.
Furthermore, this month's ETH Spot ETF saw inflows of $5.298 billion, a record high, approaching the $6.061 billion inflows of the BTC Spot ETF. This is driven by the impending interest rate cuts and the continued expansion of crypto assets in the United States, which are driving a growing influx of capital into ETH. Furthermore, an increasing number of companies are allocating ETH. By the end of the month, these companies' allocations accounted for 2.6% of the total circulating supply. While still lower than BTC's 4.6%, the growth rate is rapid, and ETH pricing power is shifting from on-exchange to over-the-counter (OTC) markets.
Conclusion
eMerge Engine shows that the BTC Metric is 0.75, indicating that BTC is in a bull market.
From a multi-dimensional analysis, BTC is still in the relay period of the fourth wave of this bull market, and it is likely to continue to rise after the August fluctuations.
Led by ETH, as the interest rate cut approaches, the risk appetite of the entire market increases, and Altseason is likely to begin.
Tariff war conflicts, US inflation and employment data are the biggest tail risks.
